User guide & software overview · October 2026
Karagem, screen by screen.
How the product collects, checks, steers and reports a programme’s data — every screen shown as it is, on the sample programme, with the steps to do it yourself. Read it here or take the PDF.
Chapter I
Introduction
What Karagem is, who it is for, and how this guide is organised.
What Karagem is
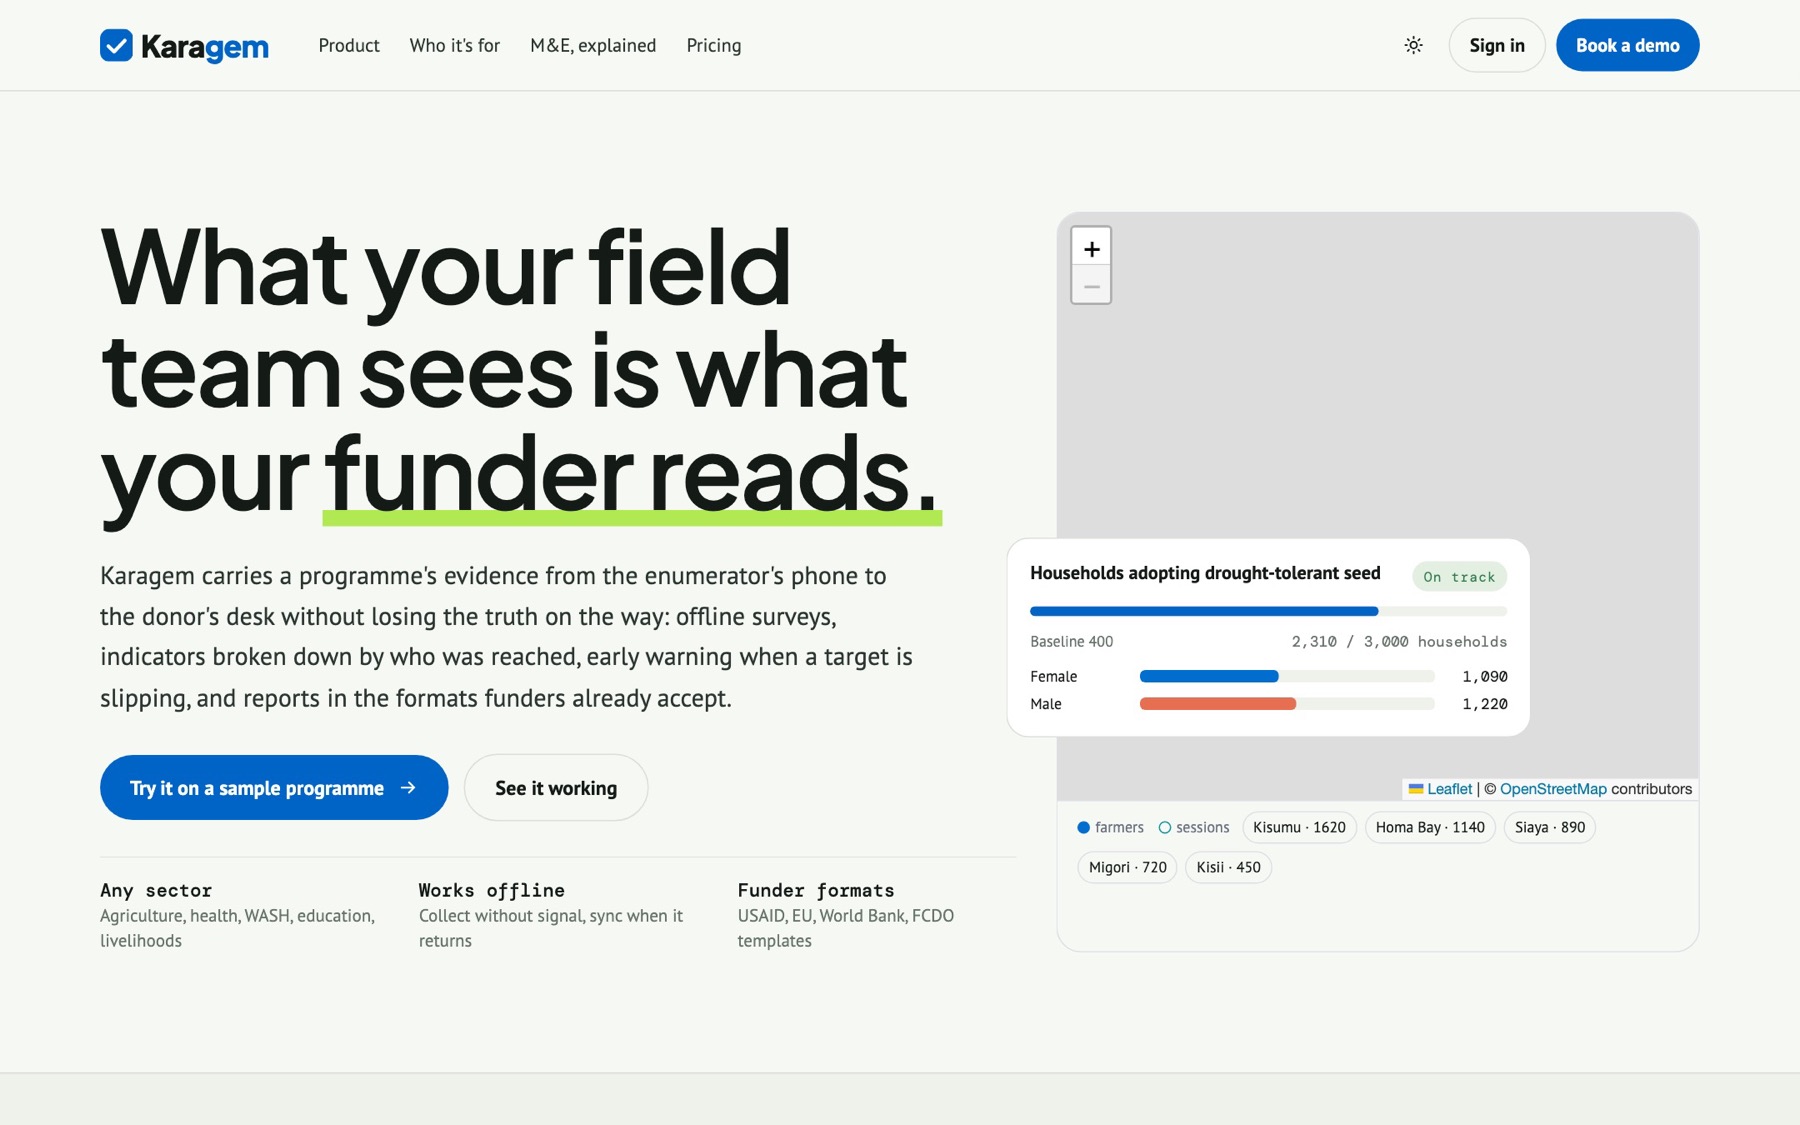
Karagem is a monitoring and evaluation platform for programmes that collect their own data: NGOs, implementing partners, cooperatives, research teams and public programmes in agriculture, health, WASH, education, livelihoods, humanitarian work, governance and the environment, in any country. It runs at me.eagmark.net in any modern browser, installs as an app on Android and iOS, and works without a network connection in the field.
It covers the whole life of a data point. A form is designed once and collected on a phone with no signal; the submission is held and synced; a value lands against the indicator it feeds; it is checked, approved, discussed and logged; it is forecast to programme end; and it is read on a dashboard, a funder link, a donor-format report or a Power BI model. Every one of those steps is a screen in this guide, shown as it actually is.
Karagem is priced per organisation, not per seat. Adding a field officer is never a budget conversation.
Who it is for
| Role | What they do in Karagem | Where they spend their time |
|---|---|---|
| Programme manager | Sets up the organisation and programmes, decides who may do what, publishes donor links, signs off reports. | Dashboard, Programmes, People, Reports, Settings |
| M&E officer | Designs indicators and surveys, approves submissions, runs quality checks, builds reports and portfolio figures. | Programmes, Surveys, Approvals, Quality, Analytics, Reports |
| Field officer / enumerator | Registers beneficiaries, collects surveys (often offline), records training attendance. | Collect (phone), Beneficiaries, Surveys, Trainings |
| Funder or partner | Reads a live, read-only dashboard through a share link. No account. | The donor link |
This guide follows the order in which data moves: Collect, Check, Steer, Report. If you are new, read Chapter III (Getting started) and then the chapter for your role. If you are evaluating the product, Chapter II (How Karagem is organised) and Chapter IX (People and permissions) answer the structural questions first.
The sample programme
Every screenshot in this document is of the real product on the sample organisation — “Resilient Smallholders 2026”: sixty beneficiaries, seven indicators, two surveys with forty responses, trainings, tasks, approvals and alerts, plus two small sibling programmes so the portfolio view has something to roll up. You can open the same data yourself at me.eagmark.net/try without creating anything, and a funder can see its public view at me.eagmark.net/share/resilient-smallholders without signing in.
Nothing in the sample data belongs to a real person. Names are synthetic and phone numbers sit under country code +999, which is reserved and cannot ring anywhere.
Chapter II
How Karagem is organised
Organisation → programmes → indicators, surveys and beneficiaries; a portfolio above; people across.
The hierarchy
- Organisation — the unit you subscribe as. It owns everything below, its members, its settings (currency, language, the word you use for the people you serve, custom profile fields) and its integrations.
- Programme — a project, grant, country package or component with its own dates, budget, funder, regions, objectives, results framework, reporting calendars, people and donor link. Most day-to-day work happens inside a programme.
- Indicators belong to a programme and to its objectives; surveys and trainings belong to a programme; beneficiaries belong to the organisation and are enrolled in one or more programmes.
- Portfolio — the organisation-wide view across programmes, including portfolio indicators that roll several programmes’ figures into one with overlap taken out.
- People — members of the organisation with an organisation role, optionally overridden per programme.
There is deliberately no deeper tree. A flat list of programmes with a portfolio view above it covers organisations up to a few dozen programmes without anyone having to learn a hierarchy first.
How data moves
| Stage | What happens | Screens |
|---|---|---|
| Collect | A form is filled on a phone, online or offline; a beneficiary is registered; attendance is taken; or rows arrive from Kobo, ODK, Google Sheets, SurveyCTO, a spreadsheet or the API. | Collect, Surveys, Beneficiaries, Trainings, Integrations |
| Check | Submissions that require approval wait in the queue; the daily scan flags duplicates, outliers and suspiciously fast interviews; every change is logged; the team discusses records in place. | Approvals, Data quality, the record drawer |
| Steer | Indicators are forecast to programme end; alerts fire on rules; tasks are planned on a timeline; the dashboard surfaces what is wrong first. | Dashboard, Analytics, Alerts, Tasks, Scorecard |
| Report | Funders read a live link; reports come out in USAID, EU, World Bank and FCDO formats; portfolio figures roll up; data flows to Power BI or Excel. | Reports, Portfolio, the donor link, Integrations |
Chapter III
Getting started
Sign in, create your organisation, load the sample data, and set the words your team will read every day.
Signing in
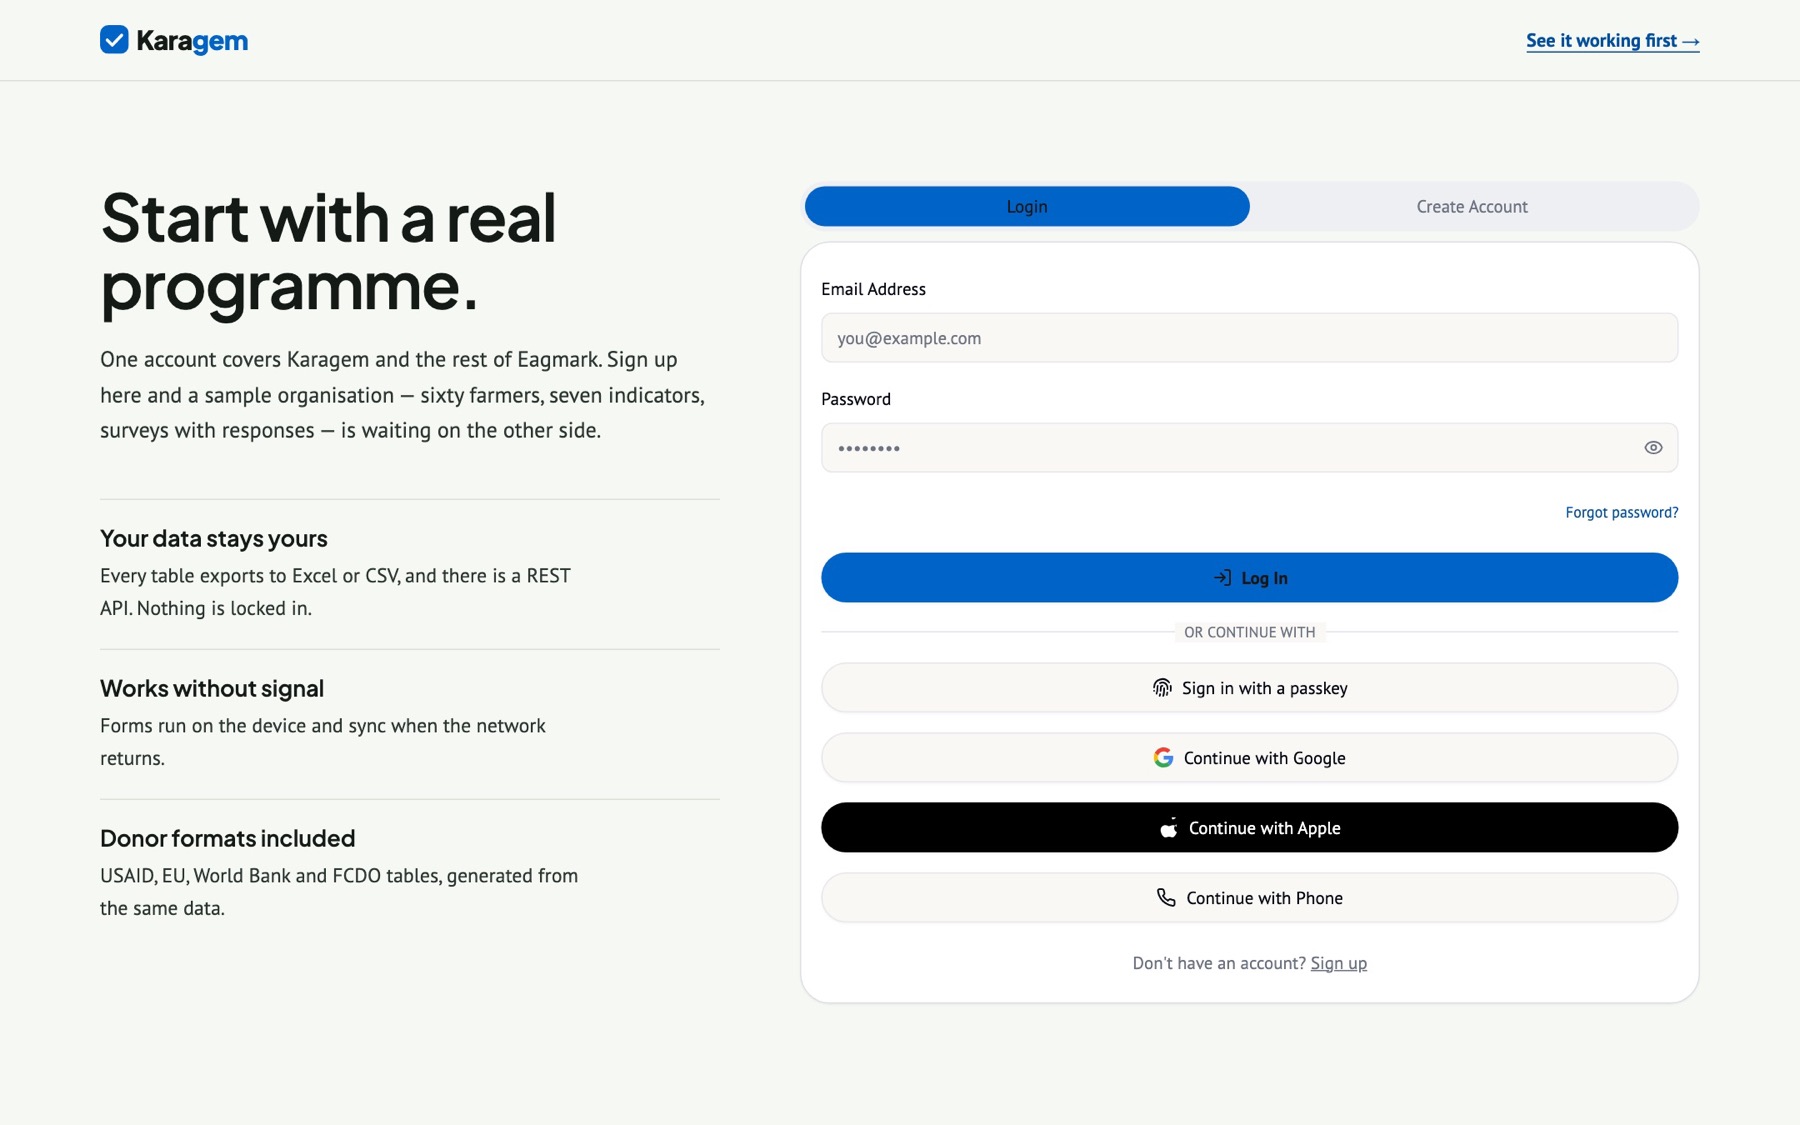
Go to me.eagmark.net and choose Open workspace or Sign in. Accounts use email and password; the same account also works on eagmark.net, and someone already signed in there arrives in Karagem without a form. There is nothing to install for the browser version.
Create your organisation
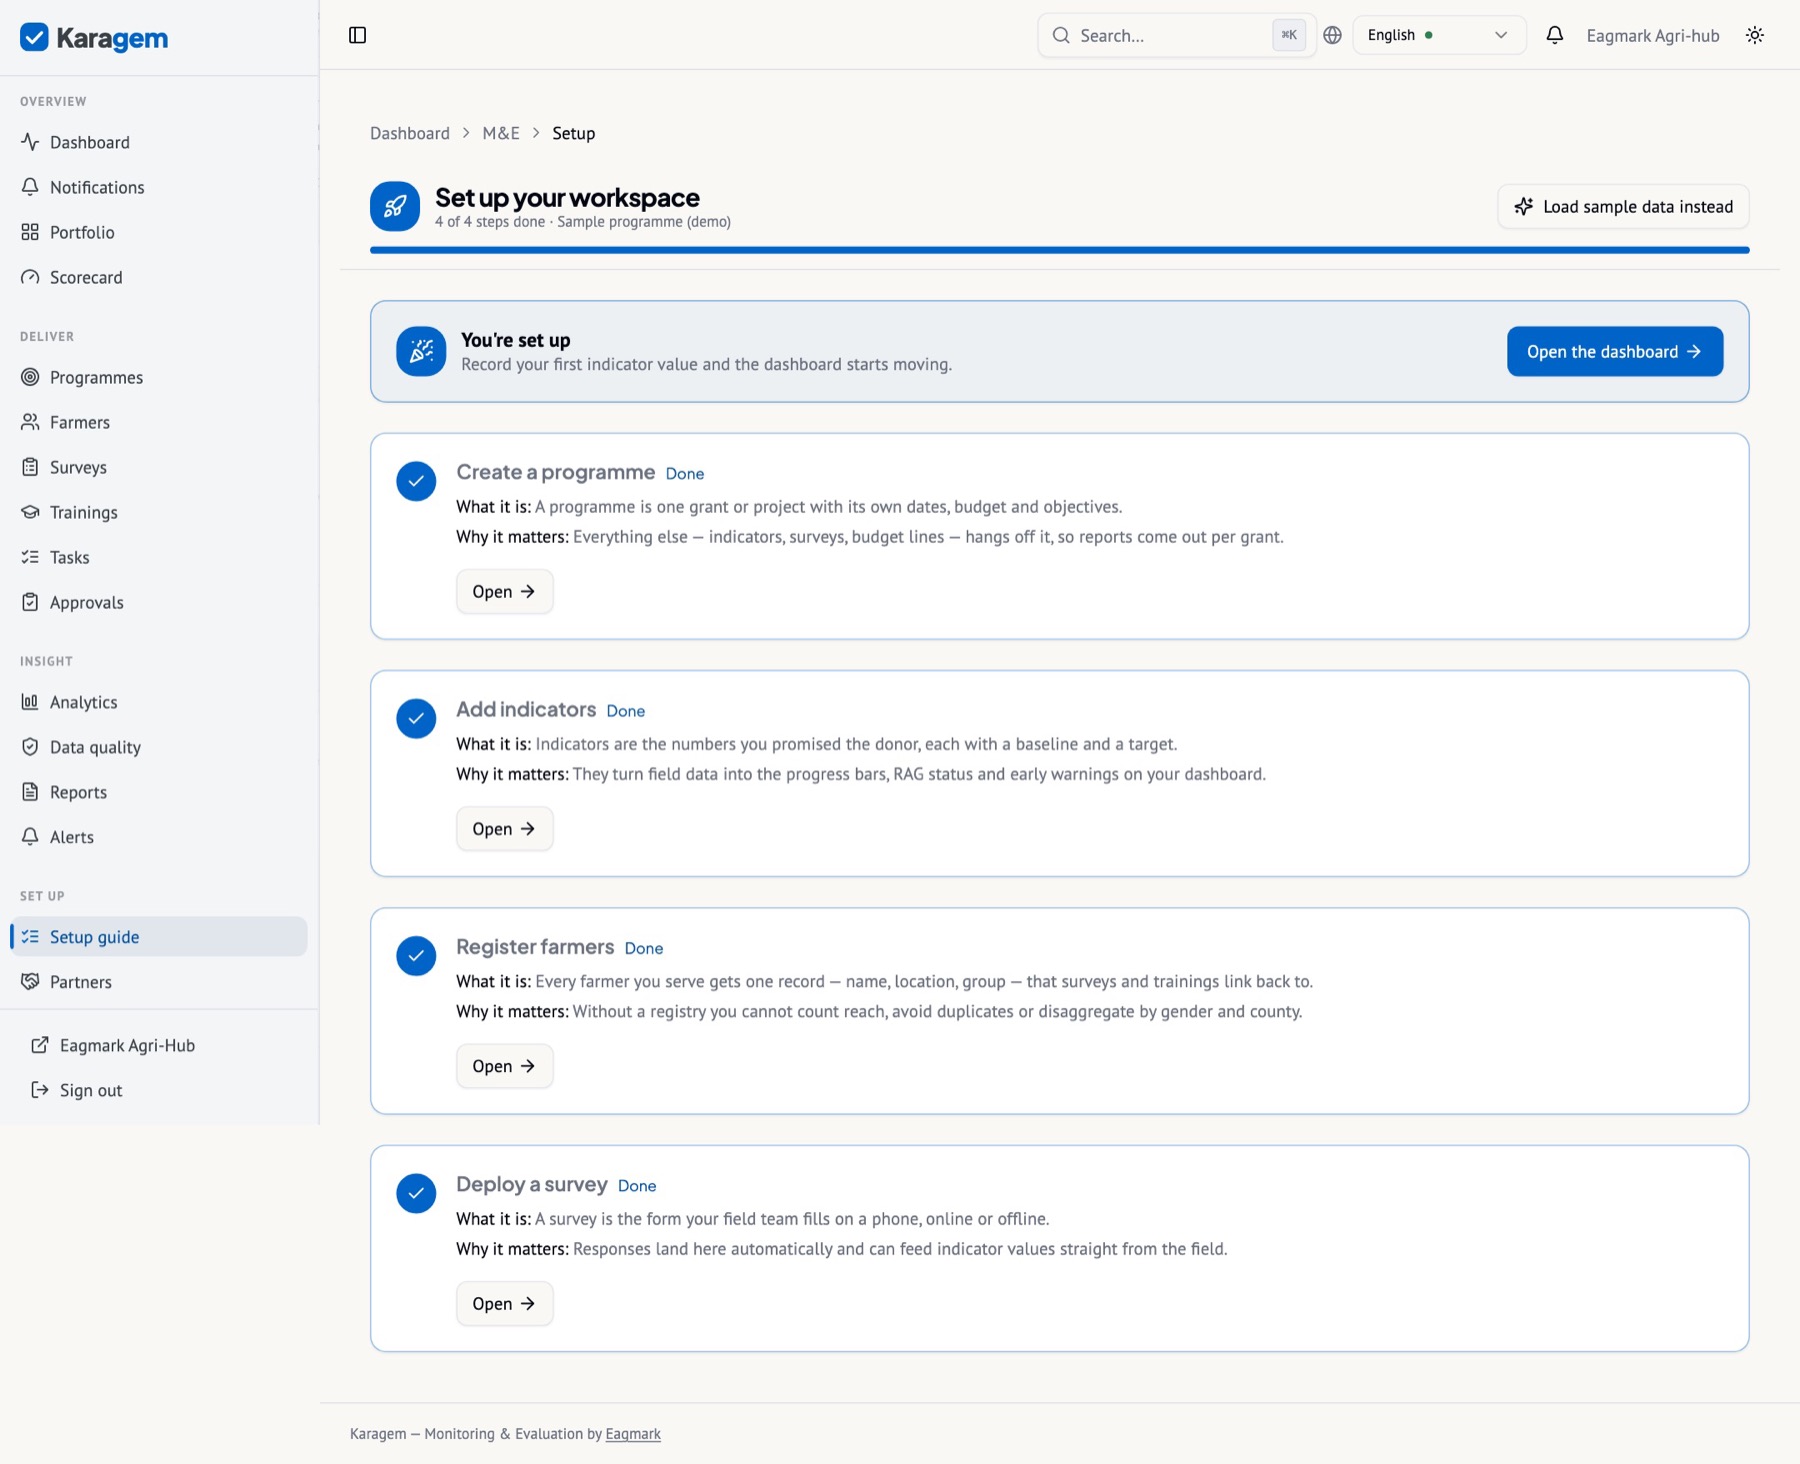
- Sign in, then open Setup guide in the sidebar (it opens automatically the first time).
- Give the organisation a name, country and contact email. You become its owner and first programme manager, and the country fills the defaults described under Organisation settings below.
- Choose the sector and the word you use for the people you serve — for example “farmers”, “households”, “patients” or “learners”. That word is used across every screen and report.
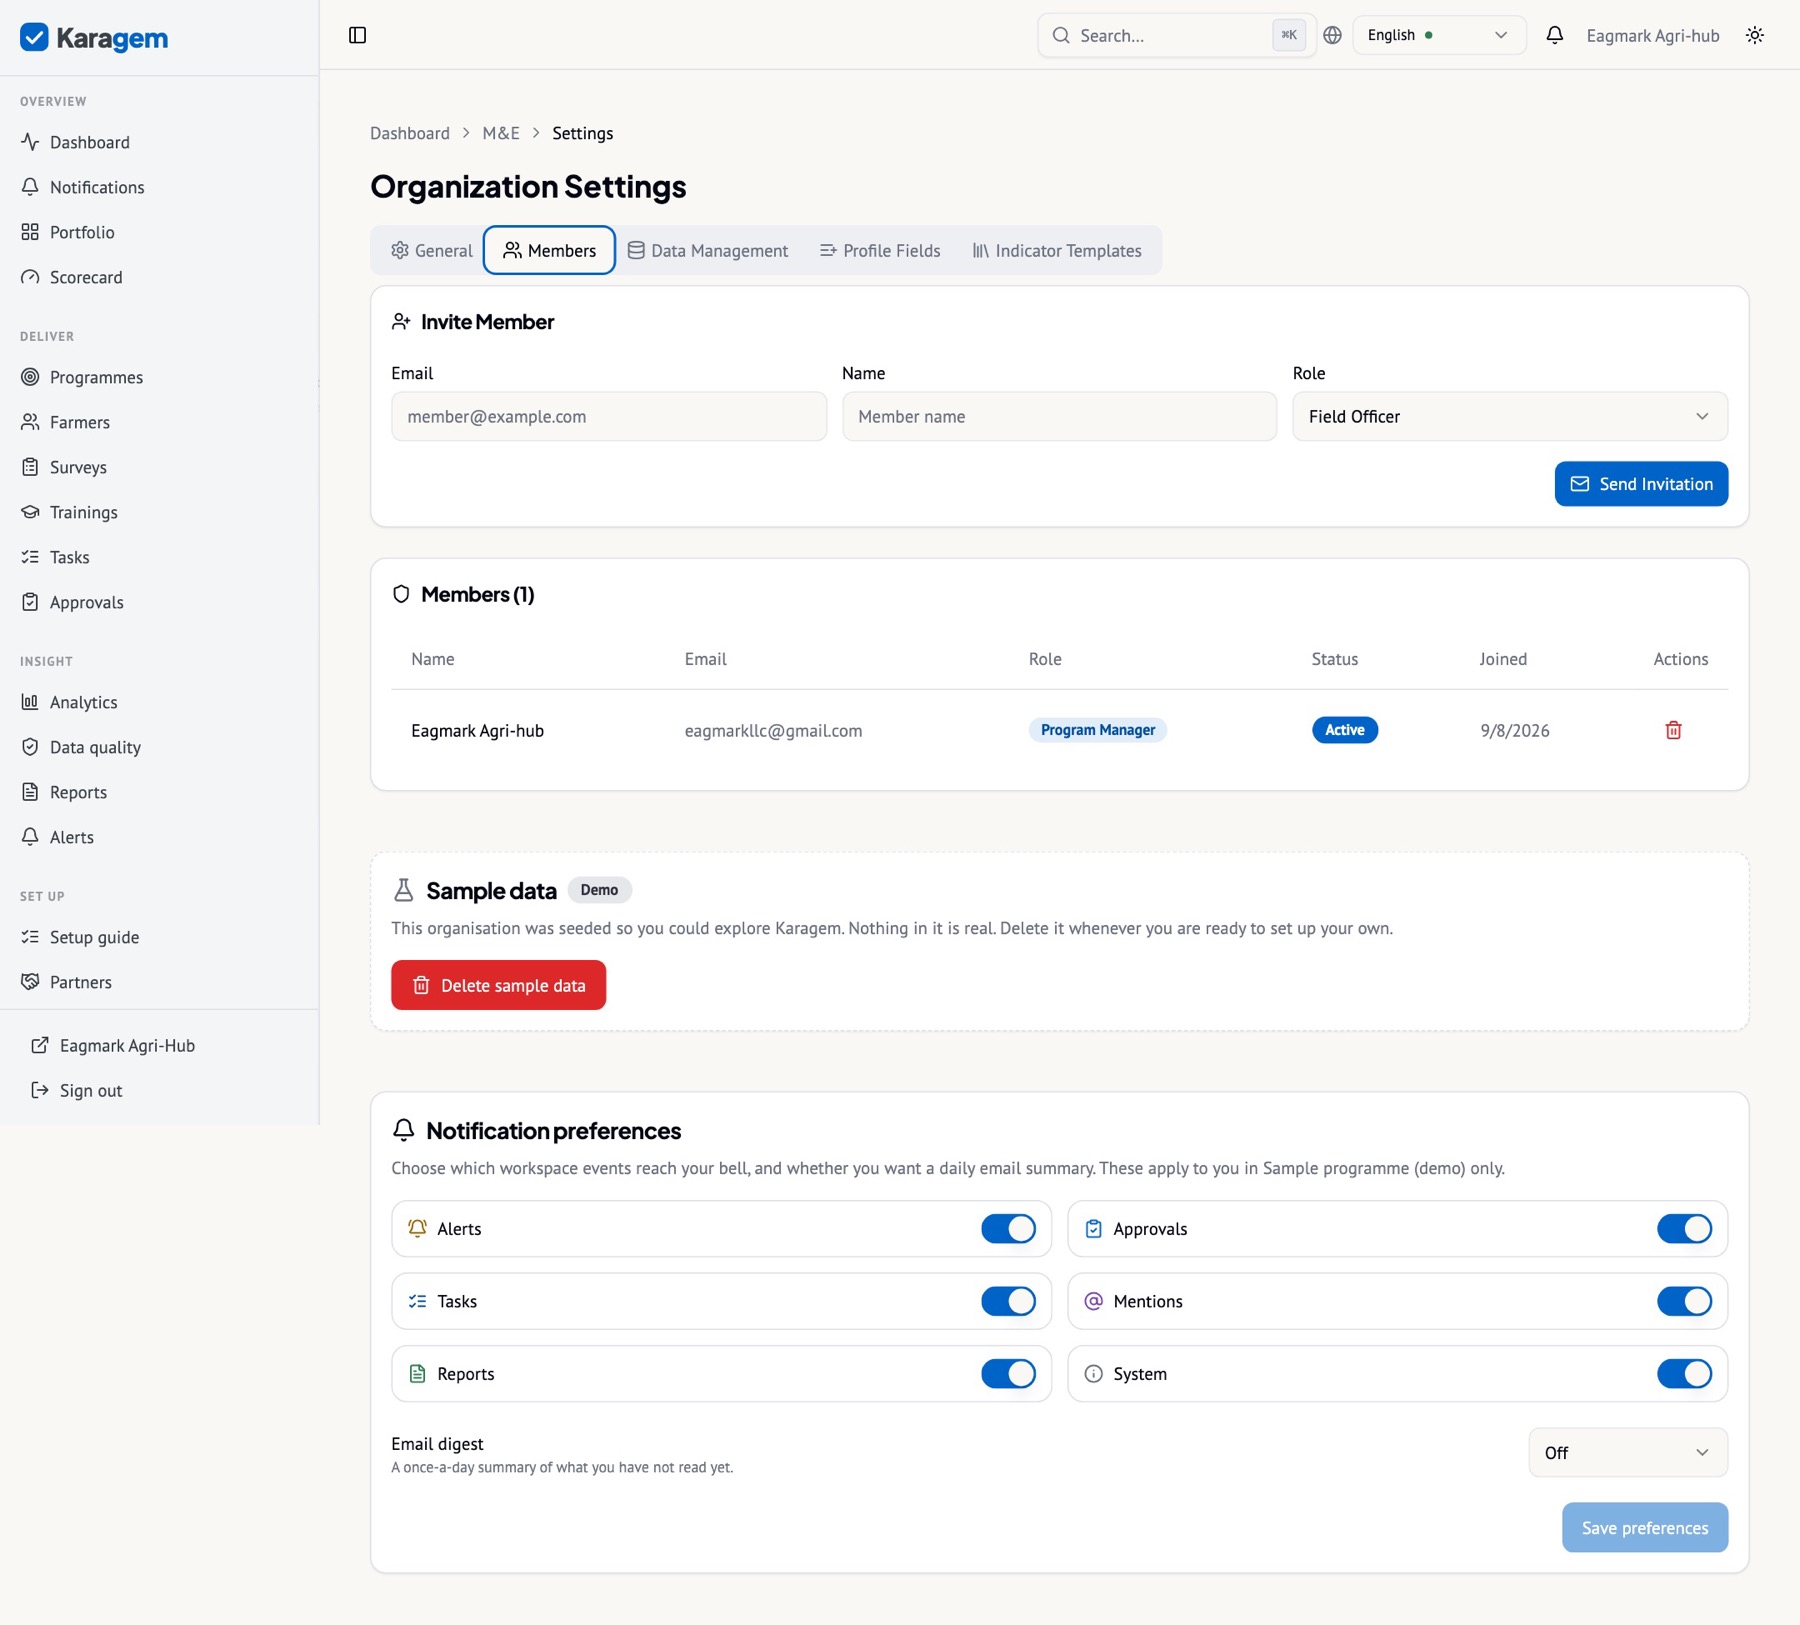
- Invite colleagues from Settings → Members with a role (Chapter IX). They receive an email and join with their own account.
Loading the sample data
Settings → Sample data creates a separate sample organisation with a complete programme so you can try every screen before touching your own data. It is deletable in one click from the same place and never mixes with your real organisation.
Tip. The sample organisation is also the safest place to train new enumerators: they can submit, approve and edit freely, and nothing they do reaches a funder.
Organisation settings
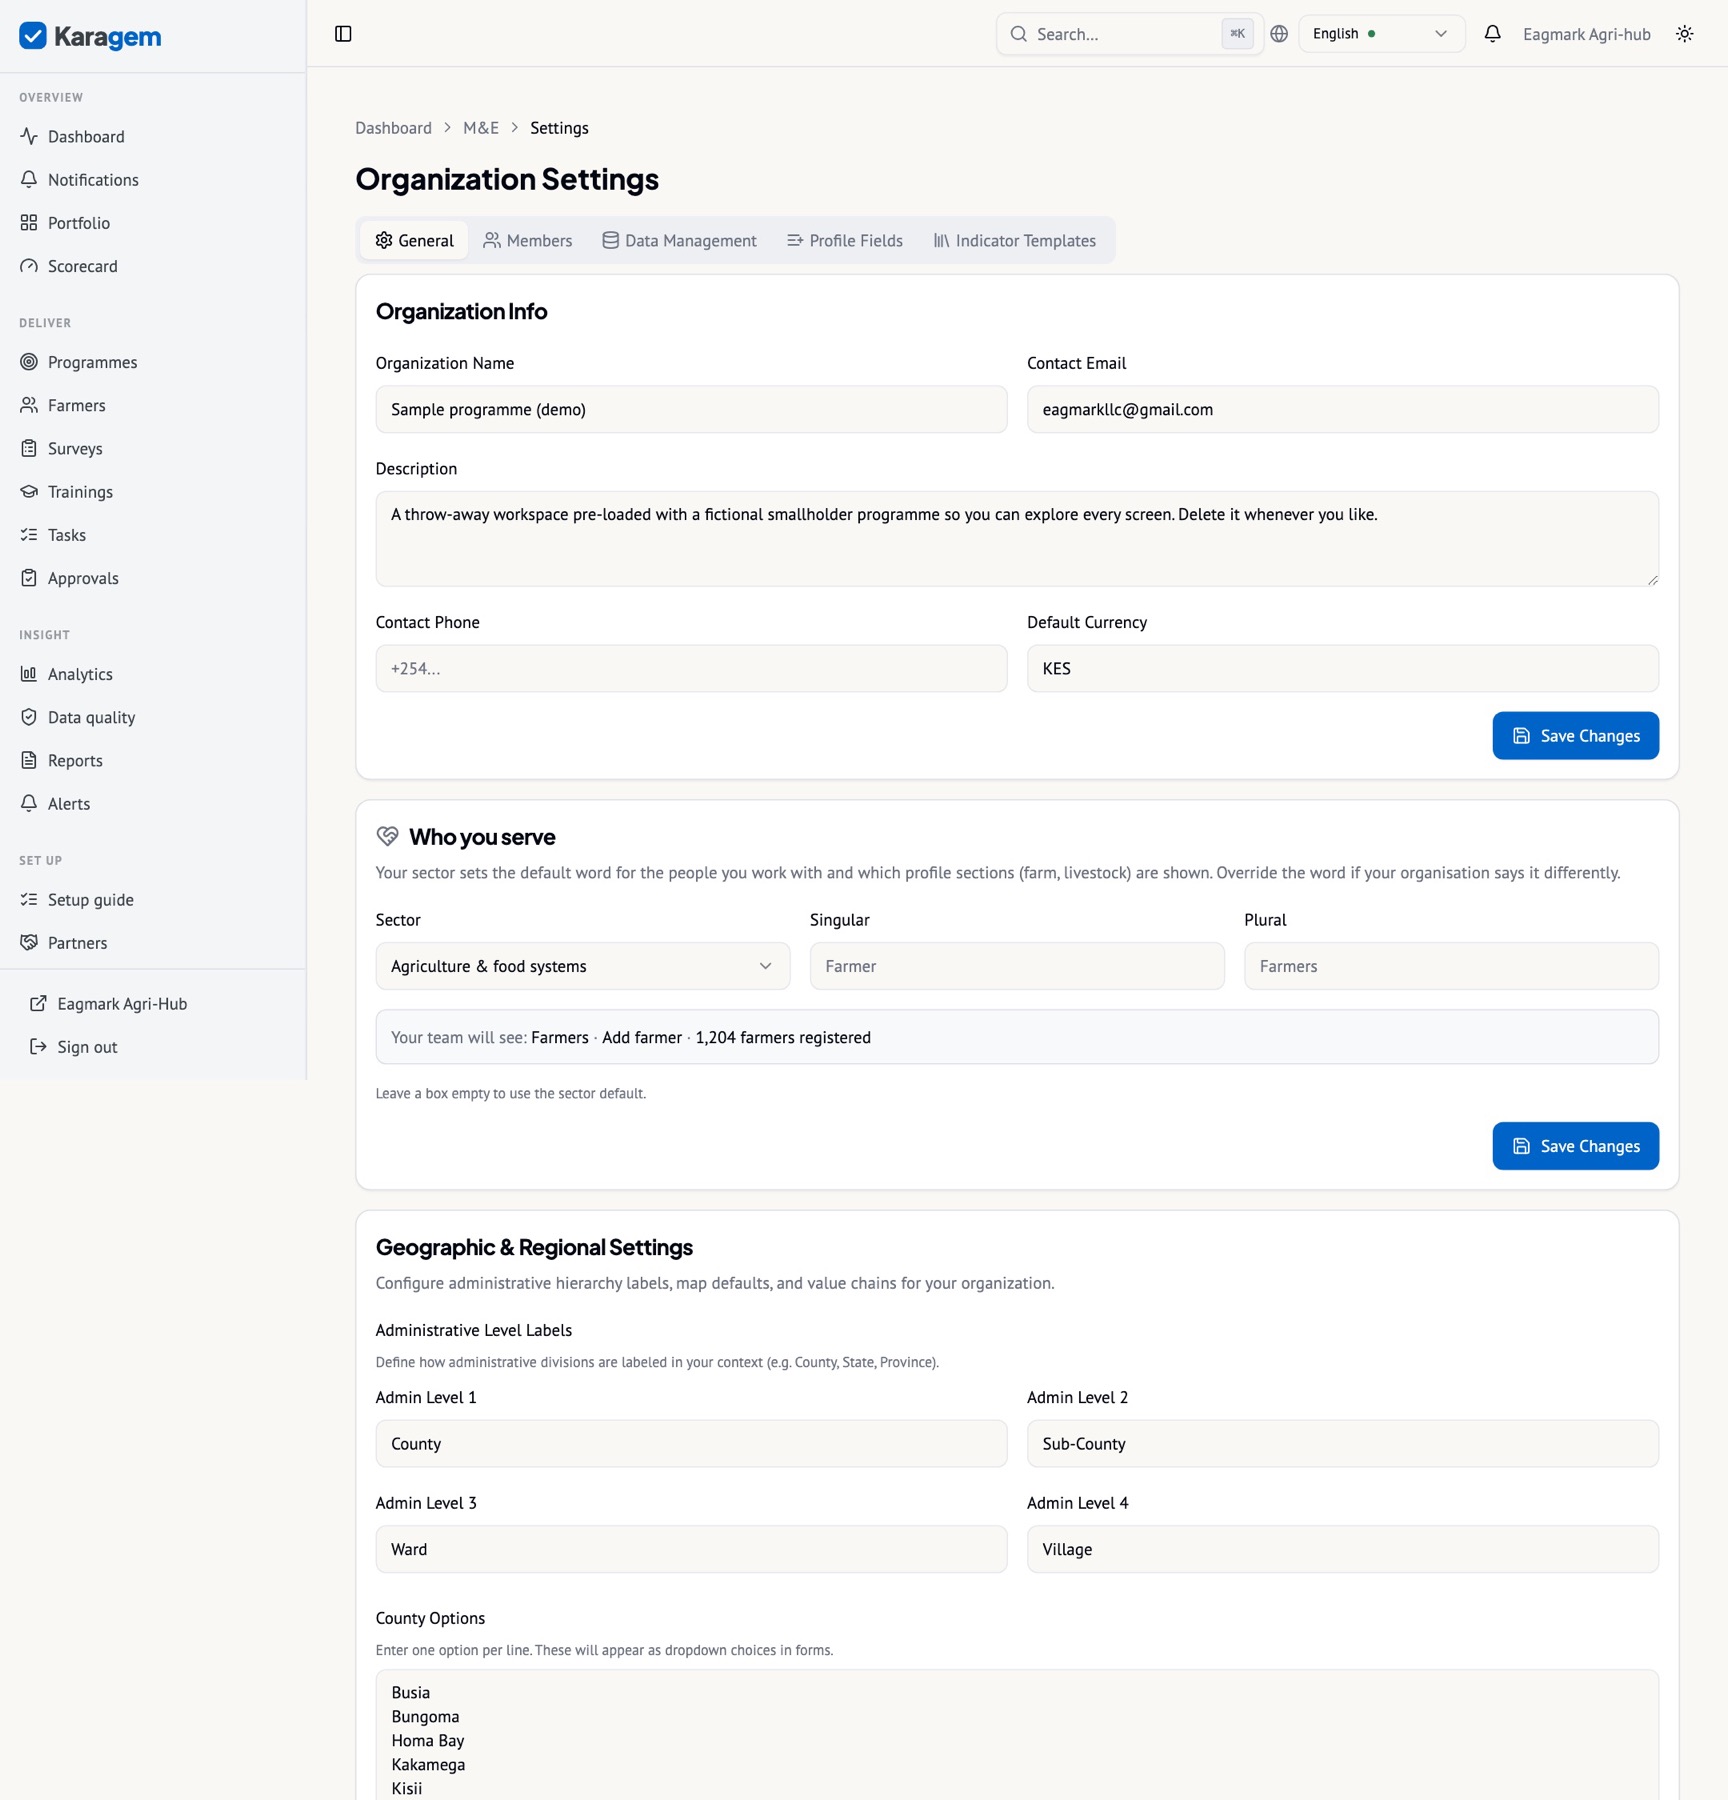
Karagem does not assume a country or a sector. Two choices on Settings → General set the words and defaults the whole workspace uses, and everything they fill in stays editable.
Country
Choosing a country fills the names of its administrative levels and the list of first-level units — for example Kenya’s 47 counties, Uganda’s districts, India’s states, Nepal’s provinces — plus the phone prefix, the currency, the map centre, the land unit (acres or hectares), the date format and the data-protection statute the consent block cites. Apply country defaults fills all of those at once; Load list for the first-level unit refreshes just the list. Countries without a known list leave it empty, and the location fields accept free text.
Sector
Choosing a sector sets the word for the people you serve (for example “farmers” in agriculture, “patients” in health, “learners” in education), which sections a beneficiary profile shows, what programmes are organised by (value chains in agriculture; thematic areas, service areas or sectors elsewhere, with a starter list) and the disaggregation presets funders in that sector ask for. Use sector defaults restores the starter list after you have changed it.
- Who you serve — the sector and the singular/plural word for beneficiaries; the administrative labels (county, district, state, region, province — whatever your country uses); the value chains, thematic areas or service areas your programmes are organised by.
- Profile fields — add your own fields to every beneficiary record (text, number, date, select, yes/no) and mark any of them as a disaggregation dimension so analytics can break results down by it.
- Approvals — an expenditure threshold above which spending waits for an M&E officer or manager.
- Notifications — which events reach each person in-app, and whether they want a daily email digest.
- Language — English and Swahili are hand-written; other languages are translated on demand.
- Data management — export everything, delete the organisation, and the data-processing summary you can hand to a funder.
One organisation or several?
An organisation is the boundary. Programmes inside one organisation share exactly three things — the beneficiary registry (one person, one record, enrolled in one or more programmes, so nobody is counted three times under three grants), the members and their roles, and the settings (country, currency, administrative names, sector, the beneficiary word, custom profile fields). They share nothing else: indicators, surveys and responses, trainings, budgets and expenditures, tasks, alerts, reports, donor links, theories of change and logframes all belong to one programme, and a new programme is linked to none of them. Only a portfolio indicator combines programmes, and only when you build one.
So the question to settle on day one is whether a new programme belongs in the same organisation. If it serves the same people, the same staff, the same country and the same sector, it does. If it has its own beneficiaries, its own staff, another country or another sector, give it its own organisation: you can belong to several and switch between them from the top of the sidebar. Two organisations share nothing, not even a login list.
- Same organisation: an agricultural NGO running three grants in the same counties with the same field team.
- Separate organisations: a consultancy managing M&E for two unrelated clients; a WASH programme and an agricultural one with different staff; country offices that must not see each other’s data.
- A funder’s reviewer who should see one programme only stays in the organisation with a programme-only View role (Programme → People).
Chapter IV
Programmes and the results framework
A programme is where the logic lives: objectives, indicators with targets and disaggregation, reporting calendars, budget, risks and documents.
Creating a programme
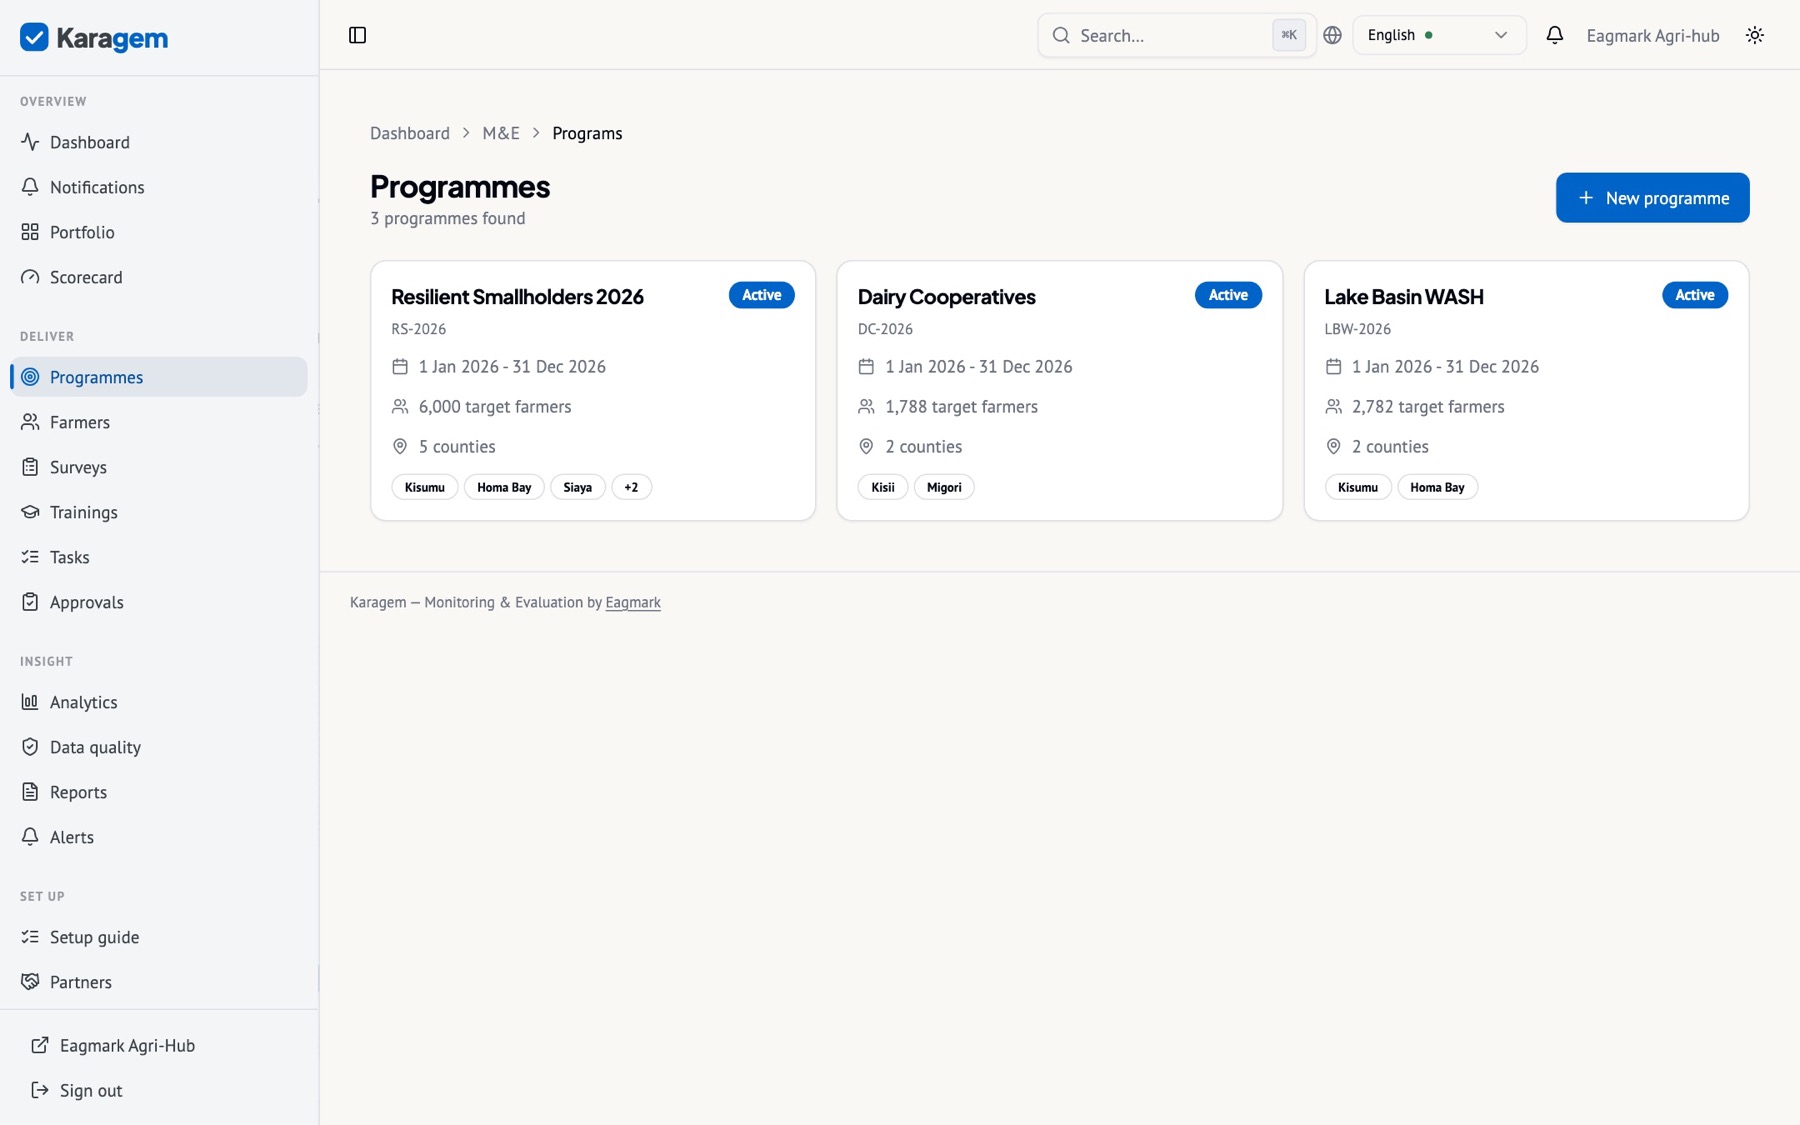
Create a programme
- Programmes → New programme. Name it, set start and end dates, the target number of beneficiaries and the regions it works in.
- Optionally add a budget and currency, the funder’s name and the reporting format it uses (USAID, EU, World Bank, FCDO or custom).
- Save as draft while you build the framework; Deploy when it is ready to collect.
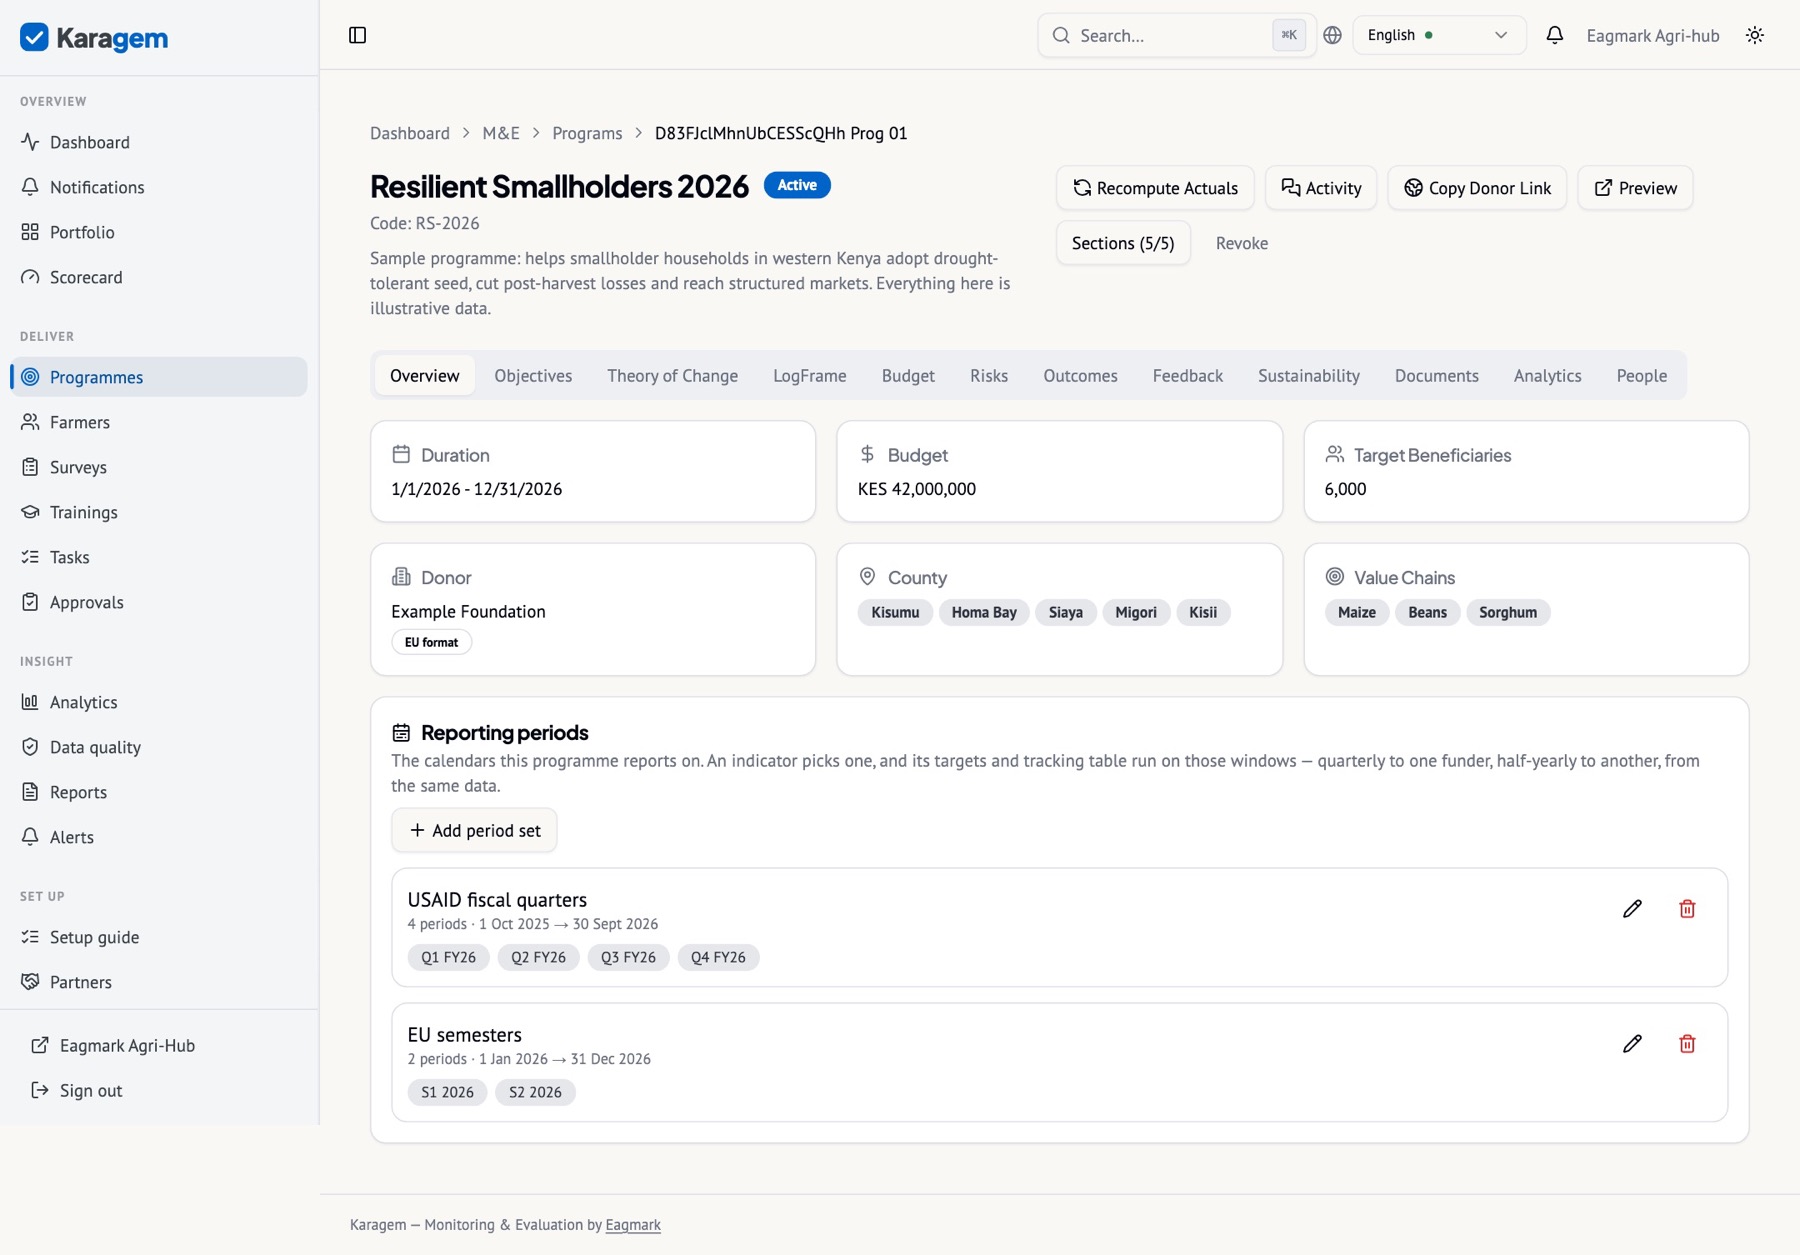
Completing, archiving and deleting
Next to the status badge on a programme, Status offers the lifecycle: Mark completed when the work is done but the programme should keep reporting and stay visible; Archive when it should leave the way — it drops out of the default list, every picker, the dashboard and the setup counts, and its public donor link is switched off, while every record and the history are kept; Reactivate reverses either. Delete permanently is for a programme created by mistake: it is refused while the programme still holds indicators, surveys, beneficiaries, budget, expenditures, tasks or approvals, and the dialog says what remains and offers Archive instead. A programme that qualifies is deleted together with its framework (objectives, theory of change, logframe, risks, documents, alert rules) after you type its name. Only programme managers and owners see these controls, and every change is logged.
Objectives and indicators
Objectives group indicators. Each indicator has a name, unit, baseline, target, reporting frequency, data source, a direction of good (increase or decrease — so a dropout rate falling counts as progress) and, optionally, disaggregation dimensions such as Gender → Female / Male / Other. Every recorded value can carry a breakdown by each dimension.
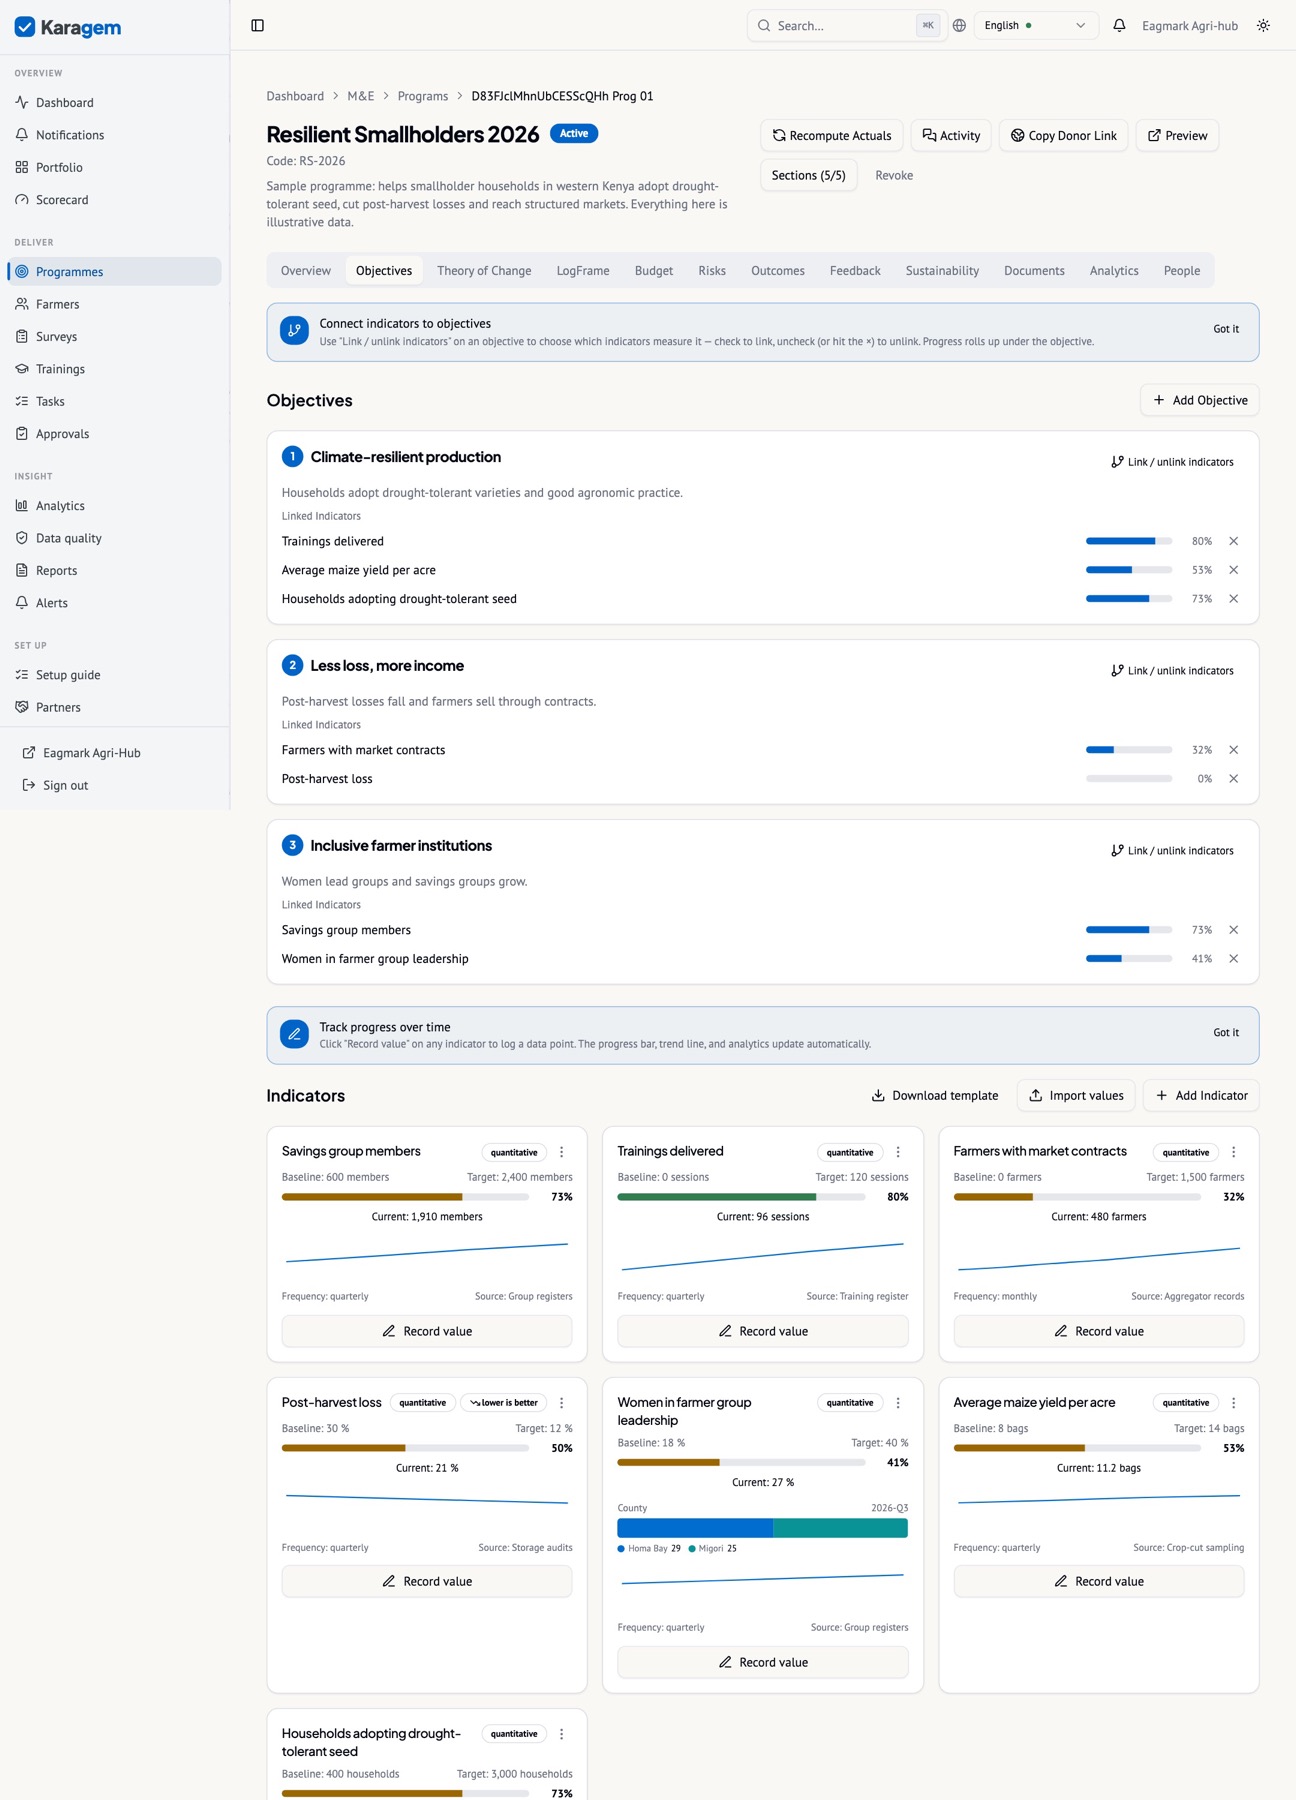
Add an indicator
- Programme → Objectives → Add indicator.
- Fill in the definition. Pick a reporting period set if the funder reports on its own calendar (see below), and set per-period targets in the grid that appears.
- Add disaggregation dimensions — the presets follow your organisation’s profile fields, and you can define your own.
- Link the indicator to one or more objectives from the objective’s card.
Values are recorded with Record value on the indicator card, imported in bulk from the Excel template (download it from the Objectives tab, fill it, import it — the whole sheet is validated before anything lands), pushed over the API, or computed automatically when the data source names something the platform already tracks (registered beneficiaries, training attendance, survey responses).
Tip. The Indicator library (sidebar) holds ready-made indicators from SDG, USAID, EU and World Bank frameworks. Adding one copies its definition into your programme where you can edit it.
Feeding indicators from surveys
An indicator can be computed from a survey question instead of typed in. Karagem works out the number for every reporting period from the responses, proposes it, and a person accepts or declines. Nothing is written to the indicator behind anyone’s back, and the responses behind every number are one click away.
Set it up
- On the indicator card, ⋯ → Feed from a survey (or, in the survey builder, the ↗ icon next to a question). Pick the survey, the question, and how to compute: sum, average, lowest or highest answer for number questions; number of responses; responses where the answer is a given value; the percentage of responses where it is; or distinct beneficiaries — each linked person counted once, which is what “farmers reached” really means.
- Optionally restrict it to responses where another question has a given answer (women trained, youth trained), and say where each disaggregation category comes from: a question in the survey, or the linked beneficiary’s gender, area, age band or Washington Group status.
- Leave auto-accept off unless you trust the feed completely. Save and compute: the first proposals appear at once.
Accepting and declining
- A proposal shows the value, the period, how many responses it came from (and, for percentages, how many answered), how many responses were not linked to a beneficiary, and the value already recorded for that period if there is one. It appears on the indicator card, in a “Proposed values” panel at the top of Objectives, and in the Approvals queue.
- Accept records the value with source “survey”, the period, the breakdown and a note naming the survey and the response count. It is dated at the end of its period, so a later manual value stays current.
- Decline records nothing, and the same number is not proposed again until responses change it.
- Only M&E officers, programme managers and owners can accept or decline — the same people who decide approvals.
- Auto-accept, per indicator and off by default, records values straight away and keeps the proposal as an audit row. Switch it off again at any time.
What keeps the numbers honest
- Only responses that count: when a survey requires approval, only approved responses feed the indicator; rejected responses never do.
- Recomputation: responses keep arriving after a value was accepted. When a period’s number changes, a fresh proposal says what it was and how many responses are new; accepting replaces the period’s value and the history keeps both, so a report generated in between stays explainable.
- Double counting: the distinct-beneficiary aggregations, the response count on every proposal, and the “Responses” link that opens exactly the responses behind the number.
- Percentages are matching responses divided by responses that answered the question, never by all responses; the denominator travels with the proposal.
- A renamed or deleted question, or a deleted survey, pauses the feed and says so on the card instead of computing nonsense; fix the survey or change the feed to resume.
- Computation runs every hour, after every connector import (Kobo, ODK, SurveyCTO, Sheets), when a feed is saved, and on ⋯ → Recompute from survey — never on every single submission, so large surveys stay cheap.
Tip. Feed a “distinct beneficiaries” indicator from your registration or check-in survey and every pull from Kobo turns into a reach figure you only have to confirm.
Reporting periods and periodic targets
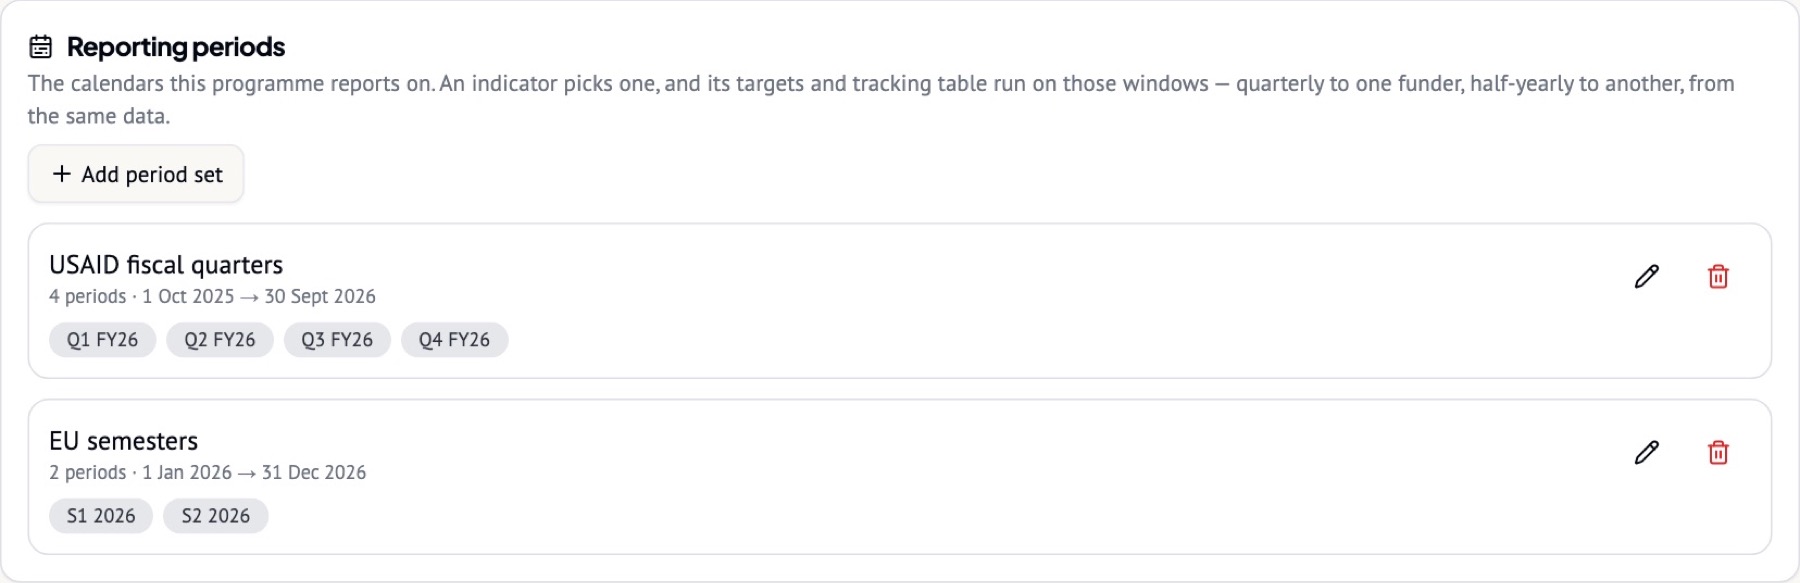
Funders do not share a calendar. USAID’s fiscal year starts in October; FCDO’s in April; an EU action may run eighteen-month semesters from its contract date. A programme keeps one or more named reporting period sets, and each indicator chooses the one it reports on. Its targets are then per period, the record dialog offers the set’s labels, and the history sheet shows a target-versus-actual tracking table on that calendar.
Set up a funder calendar
- Programme → Overview → Reporting periods → Add period set.
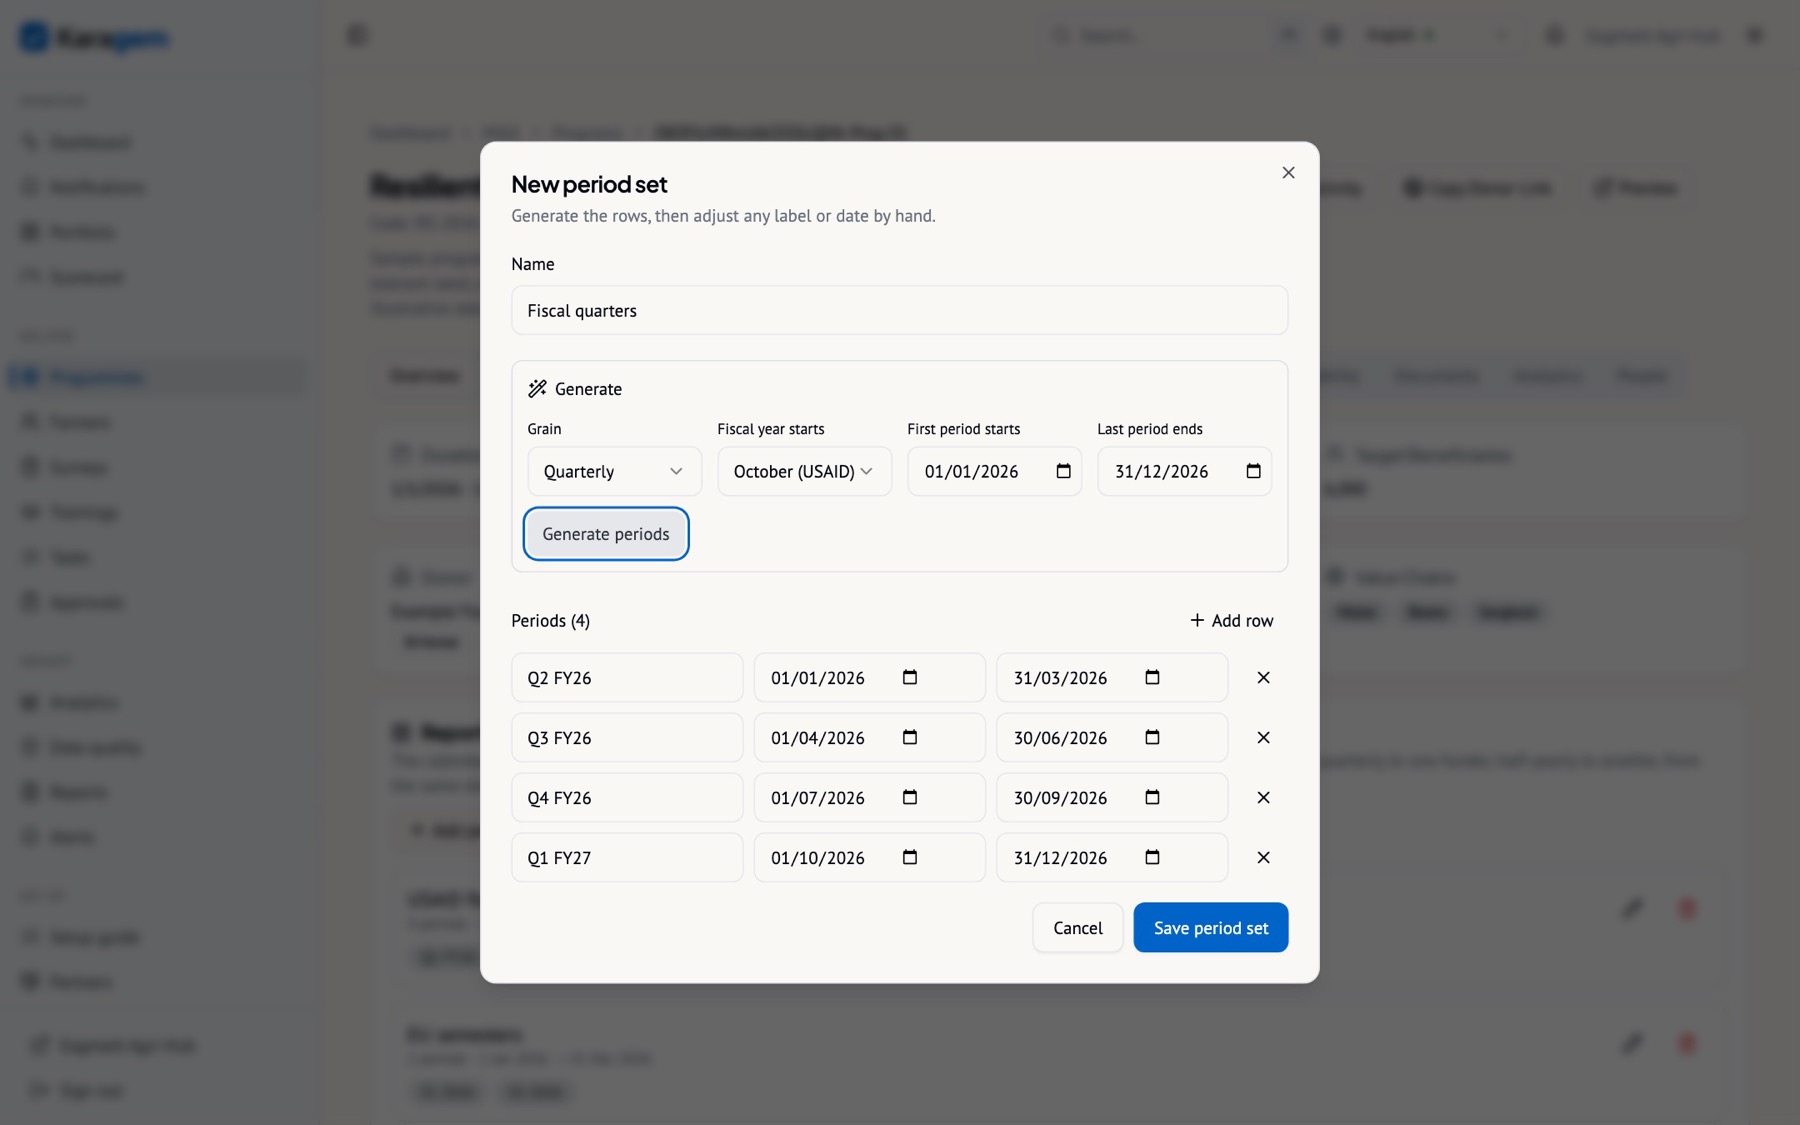
- Choose the grain (monthly, quarterly, semi-annual, annual), the month the funder’s year starts, and the first and last dates. Generate.
- Adjust any label or date, name the set (“USAID fiscal quarters”), save.
- On each indicator, choose the set under Reporting periods and enter targets per period.
Logframe, theory of change, budget, risks, documents
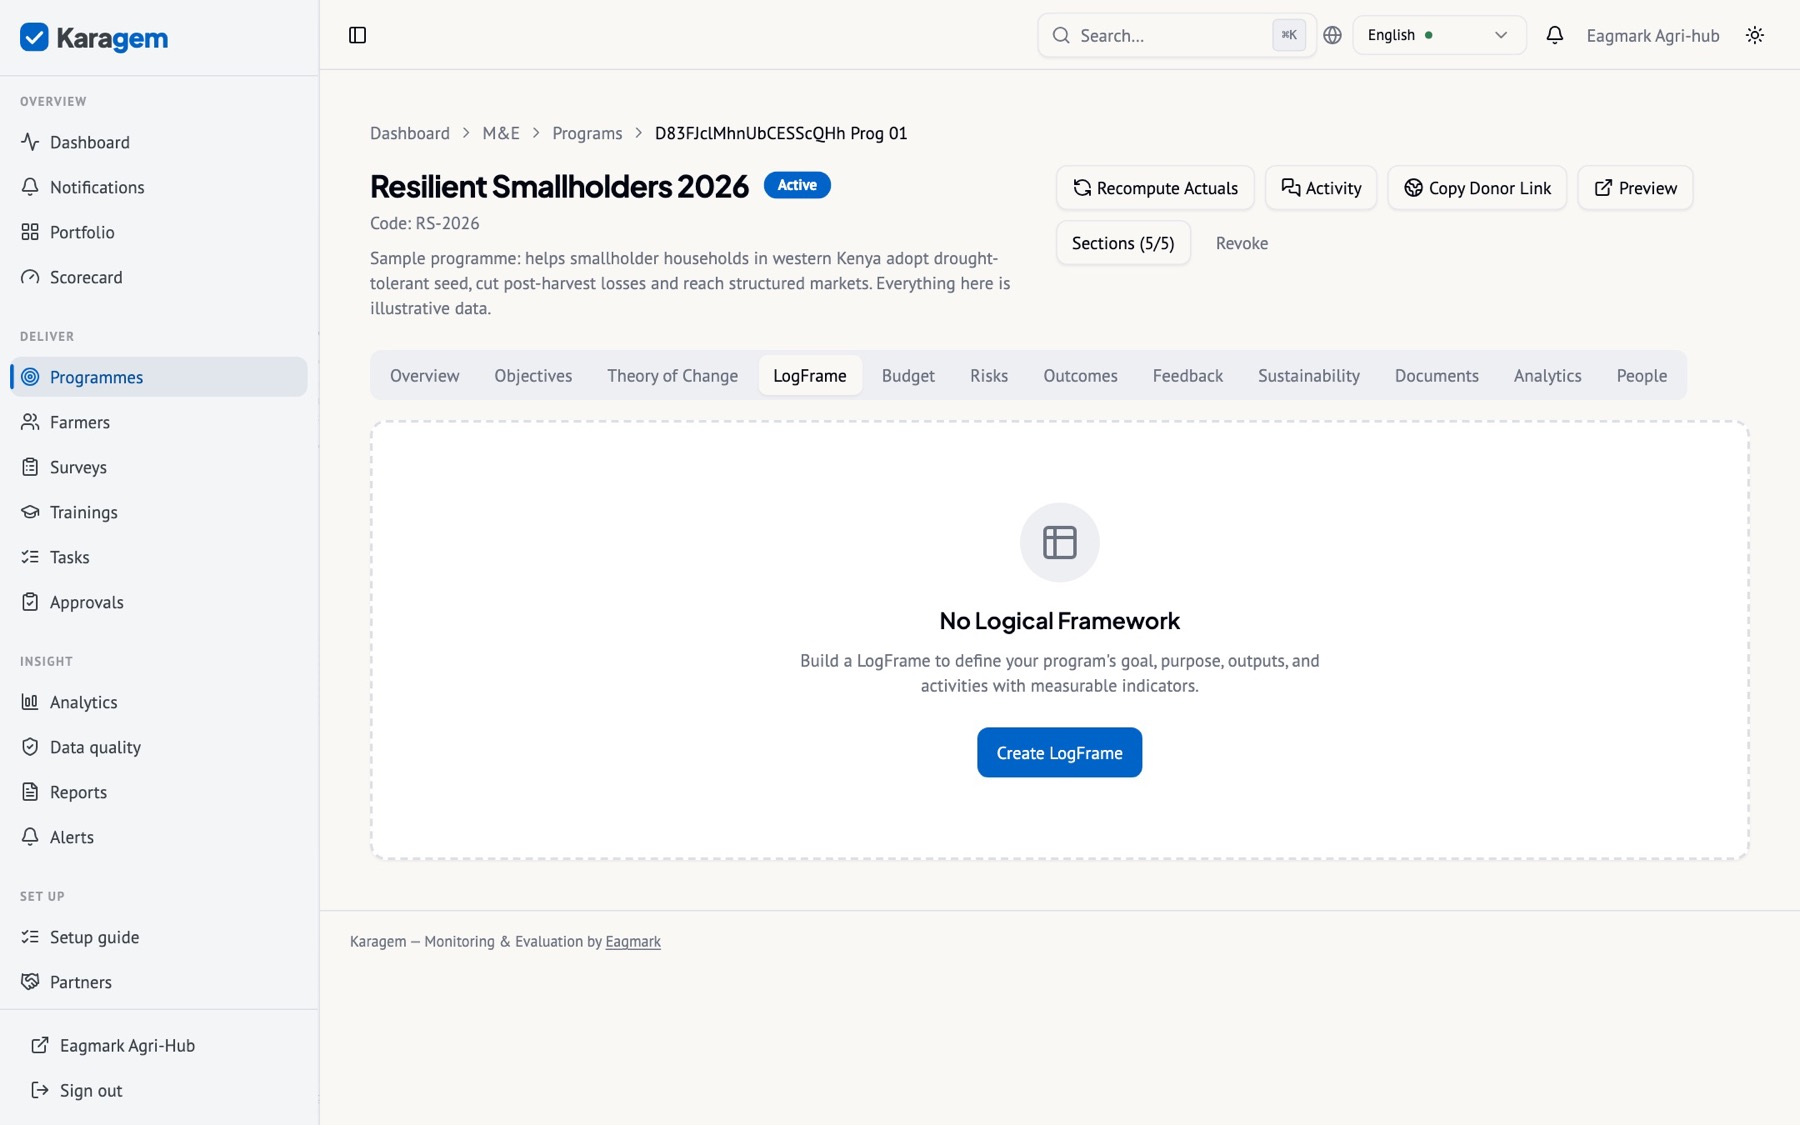
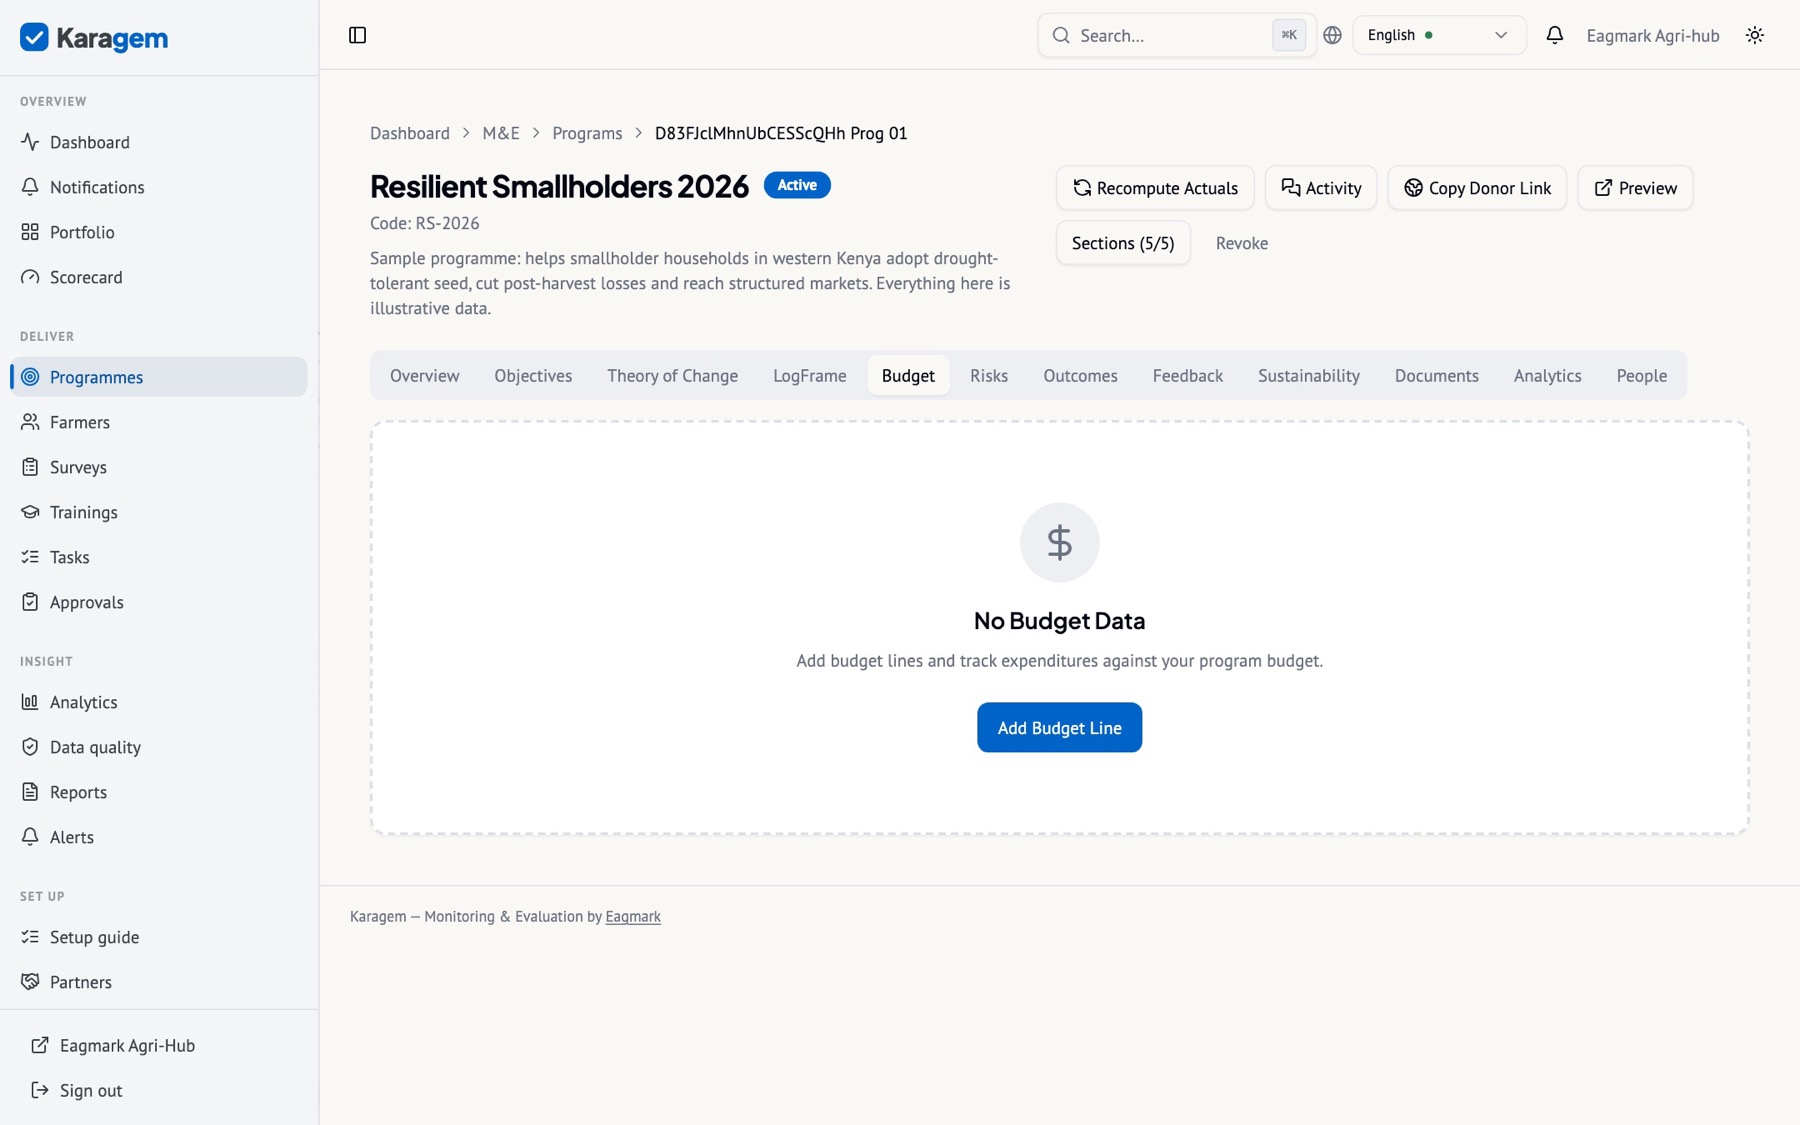
- Theory of change — a node editor for inputs, activities, outputs, outcomes and impact, with indicators attached to nodes.
- Risks — a register with likelihood, impact, owner and mitigation.
- Outcomes and feedback — qualitative outcome records and beneficiary feedback with follow-up status.
- Sustainability — an exit plan with handover milestones.
- Documents — proposal, agreements, reports and evidence attached to the programme.
Chapter V
Collect
Beneficiaries, surveys designed once and collected anywhere, trainings and attendance, and the connectors that bring in data your team already collects elsewhere.
Beneficiaries
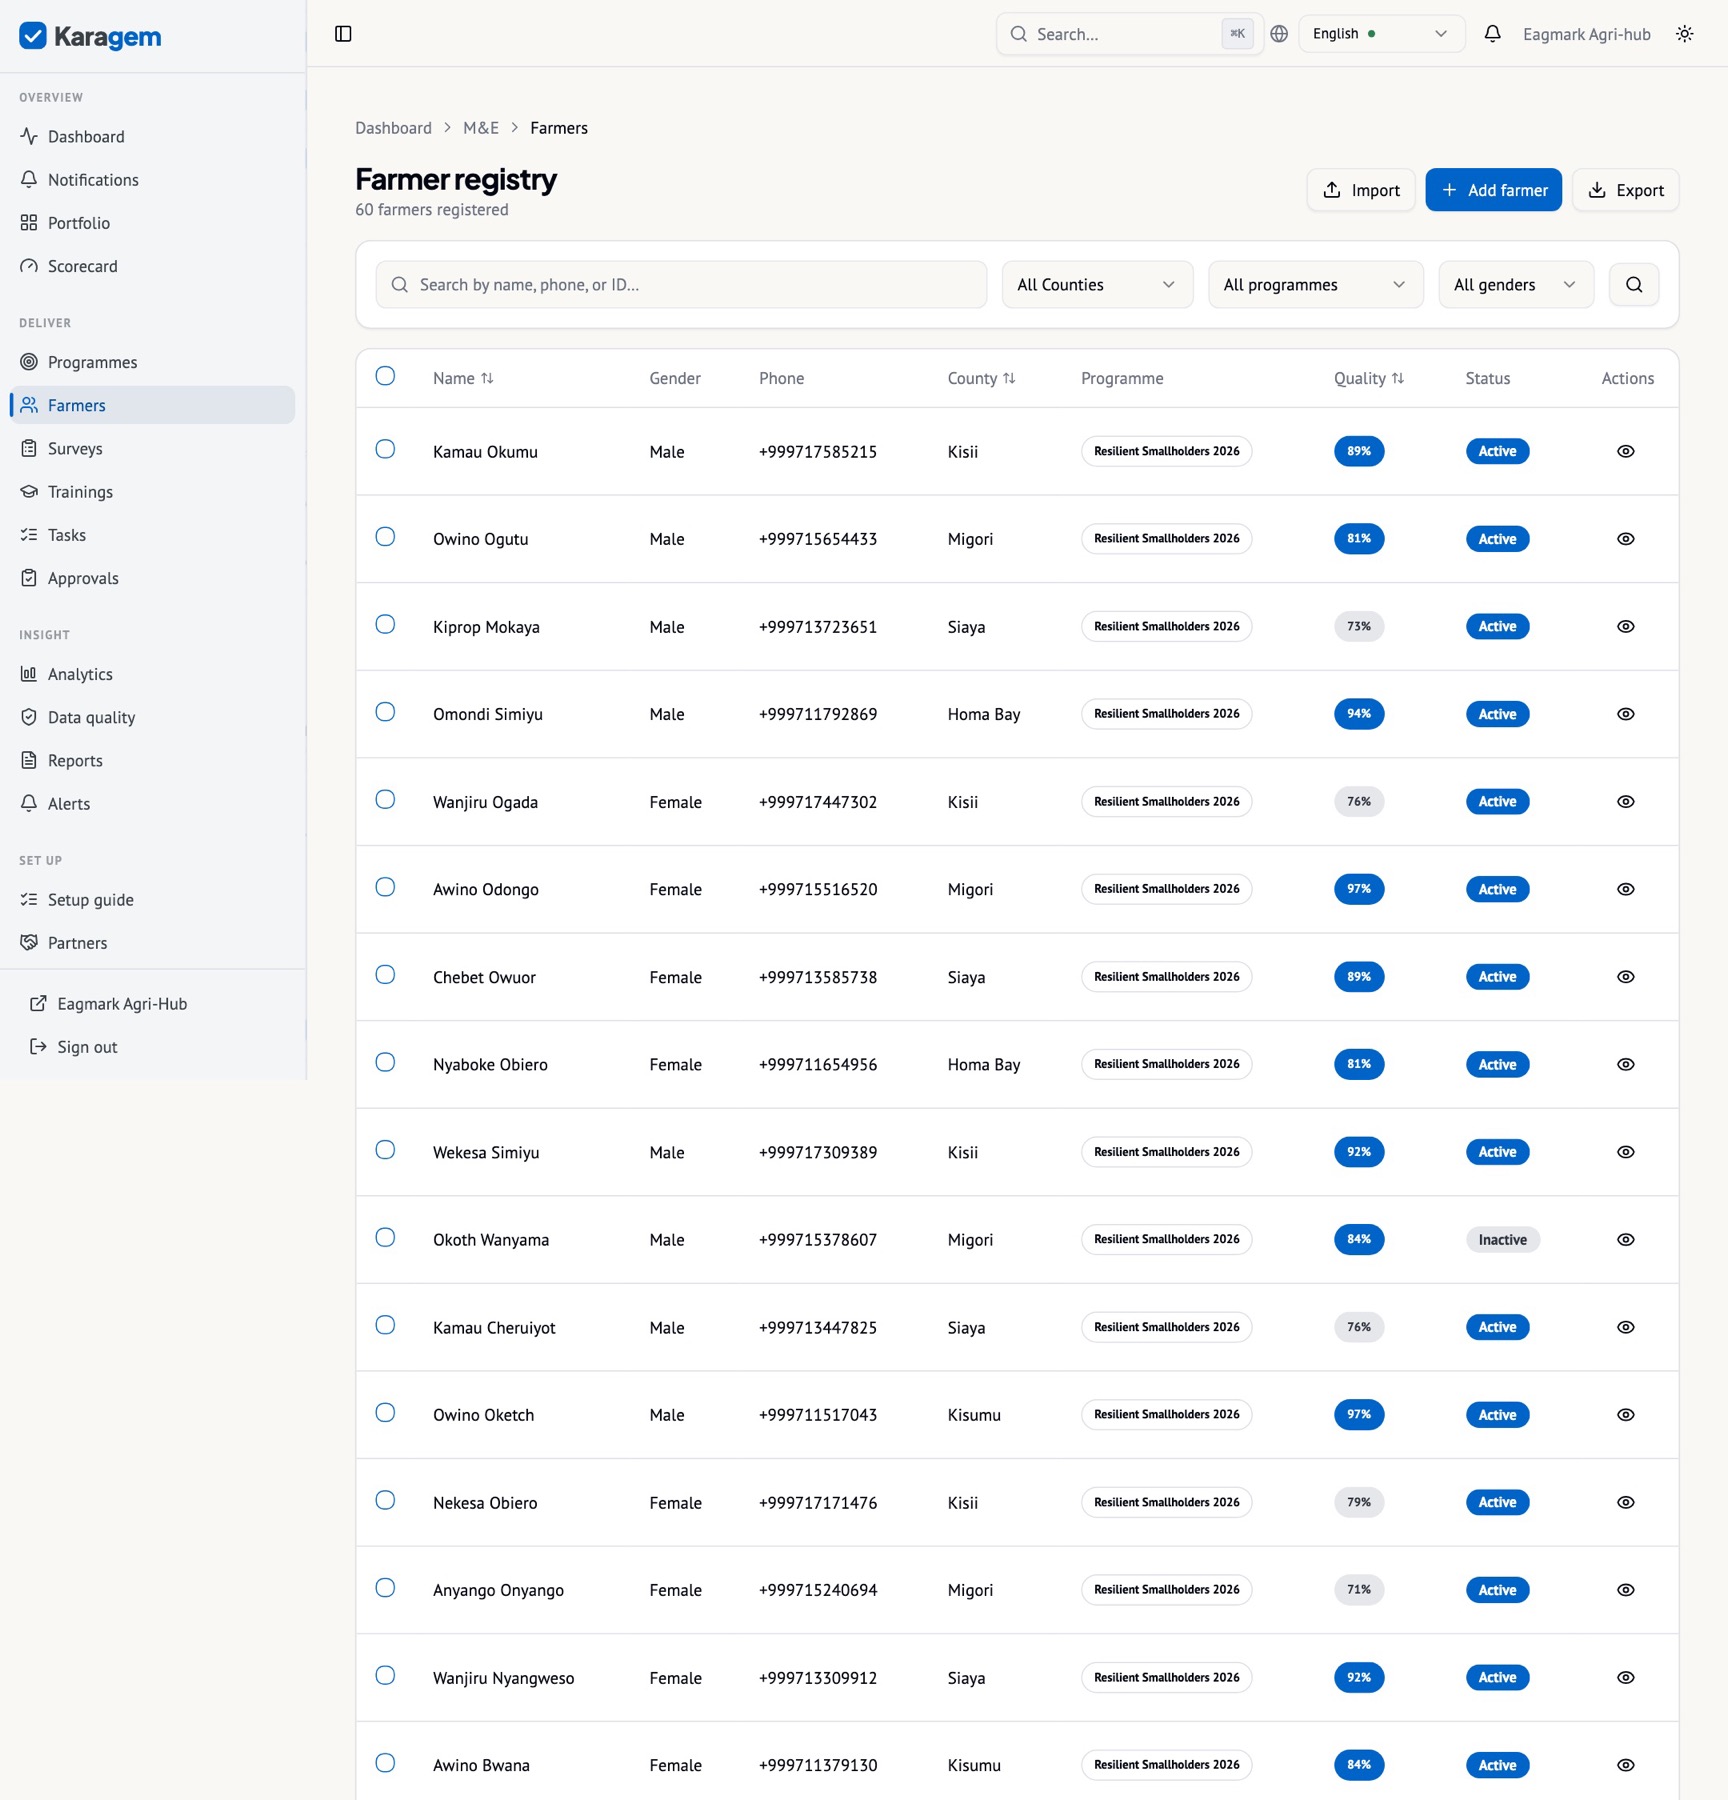
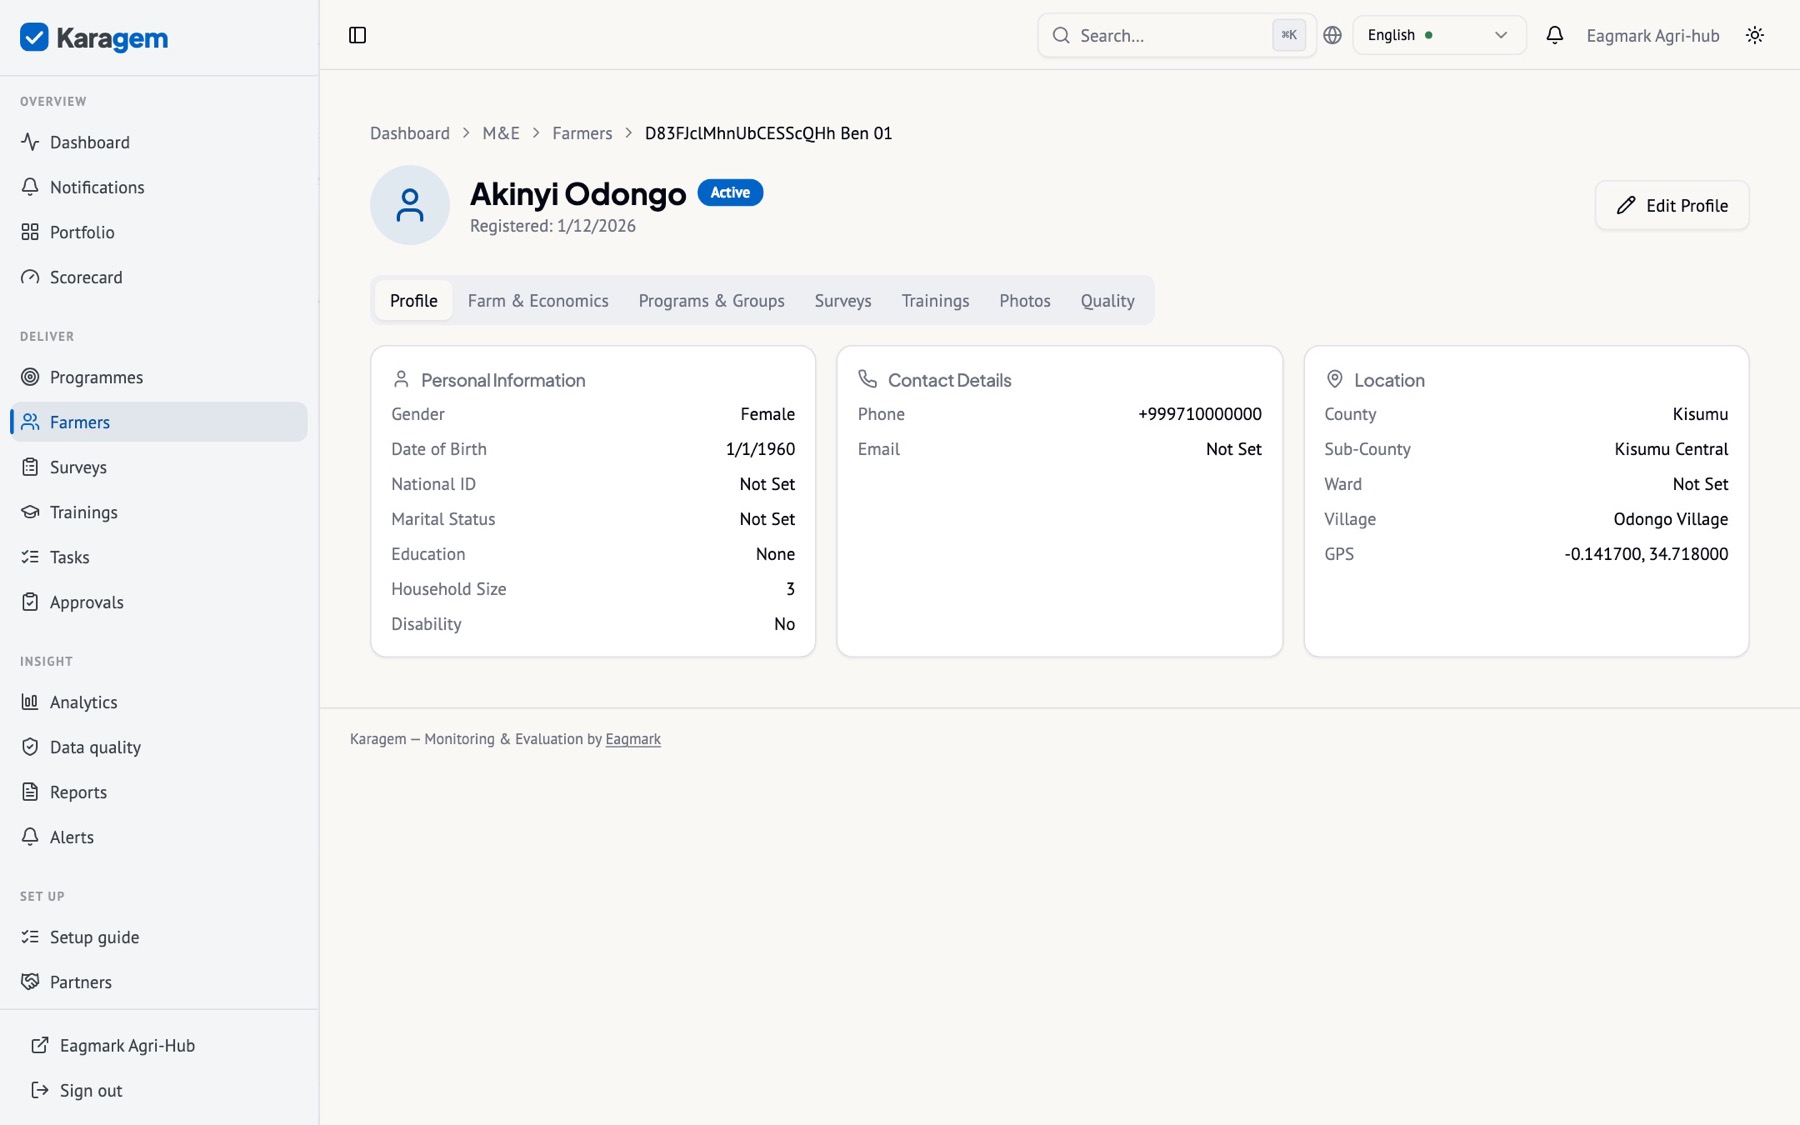
Each record holds identity, location (including a GPS point), programme enrolments, group membership, the organisation’s custom fields, and a data-quality score. Duplicates are detected on registration by a hash of the identifying fields and again by the daily scan.
Import a registry
- Beneficiaries → Import. Download the template, or upload your own CSV/Excel.
- Map columns to fields; unmapped columns can become custom fields on the spot.
- Preview the rows that would be created, updated or skipped as duplicates; confirm.
Surveys
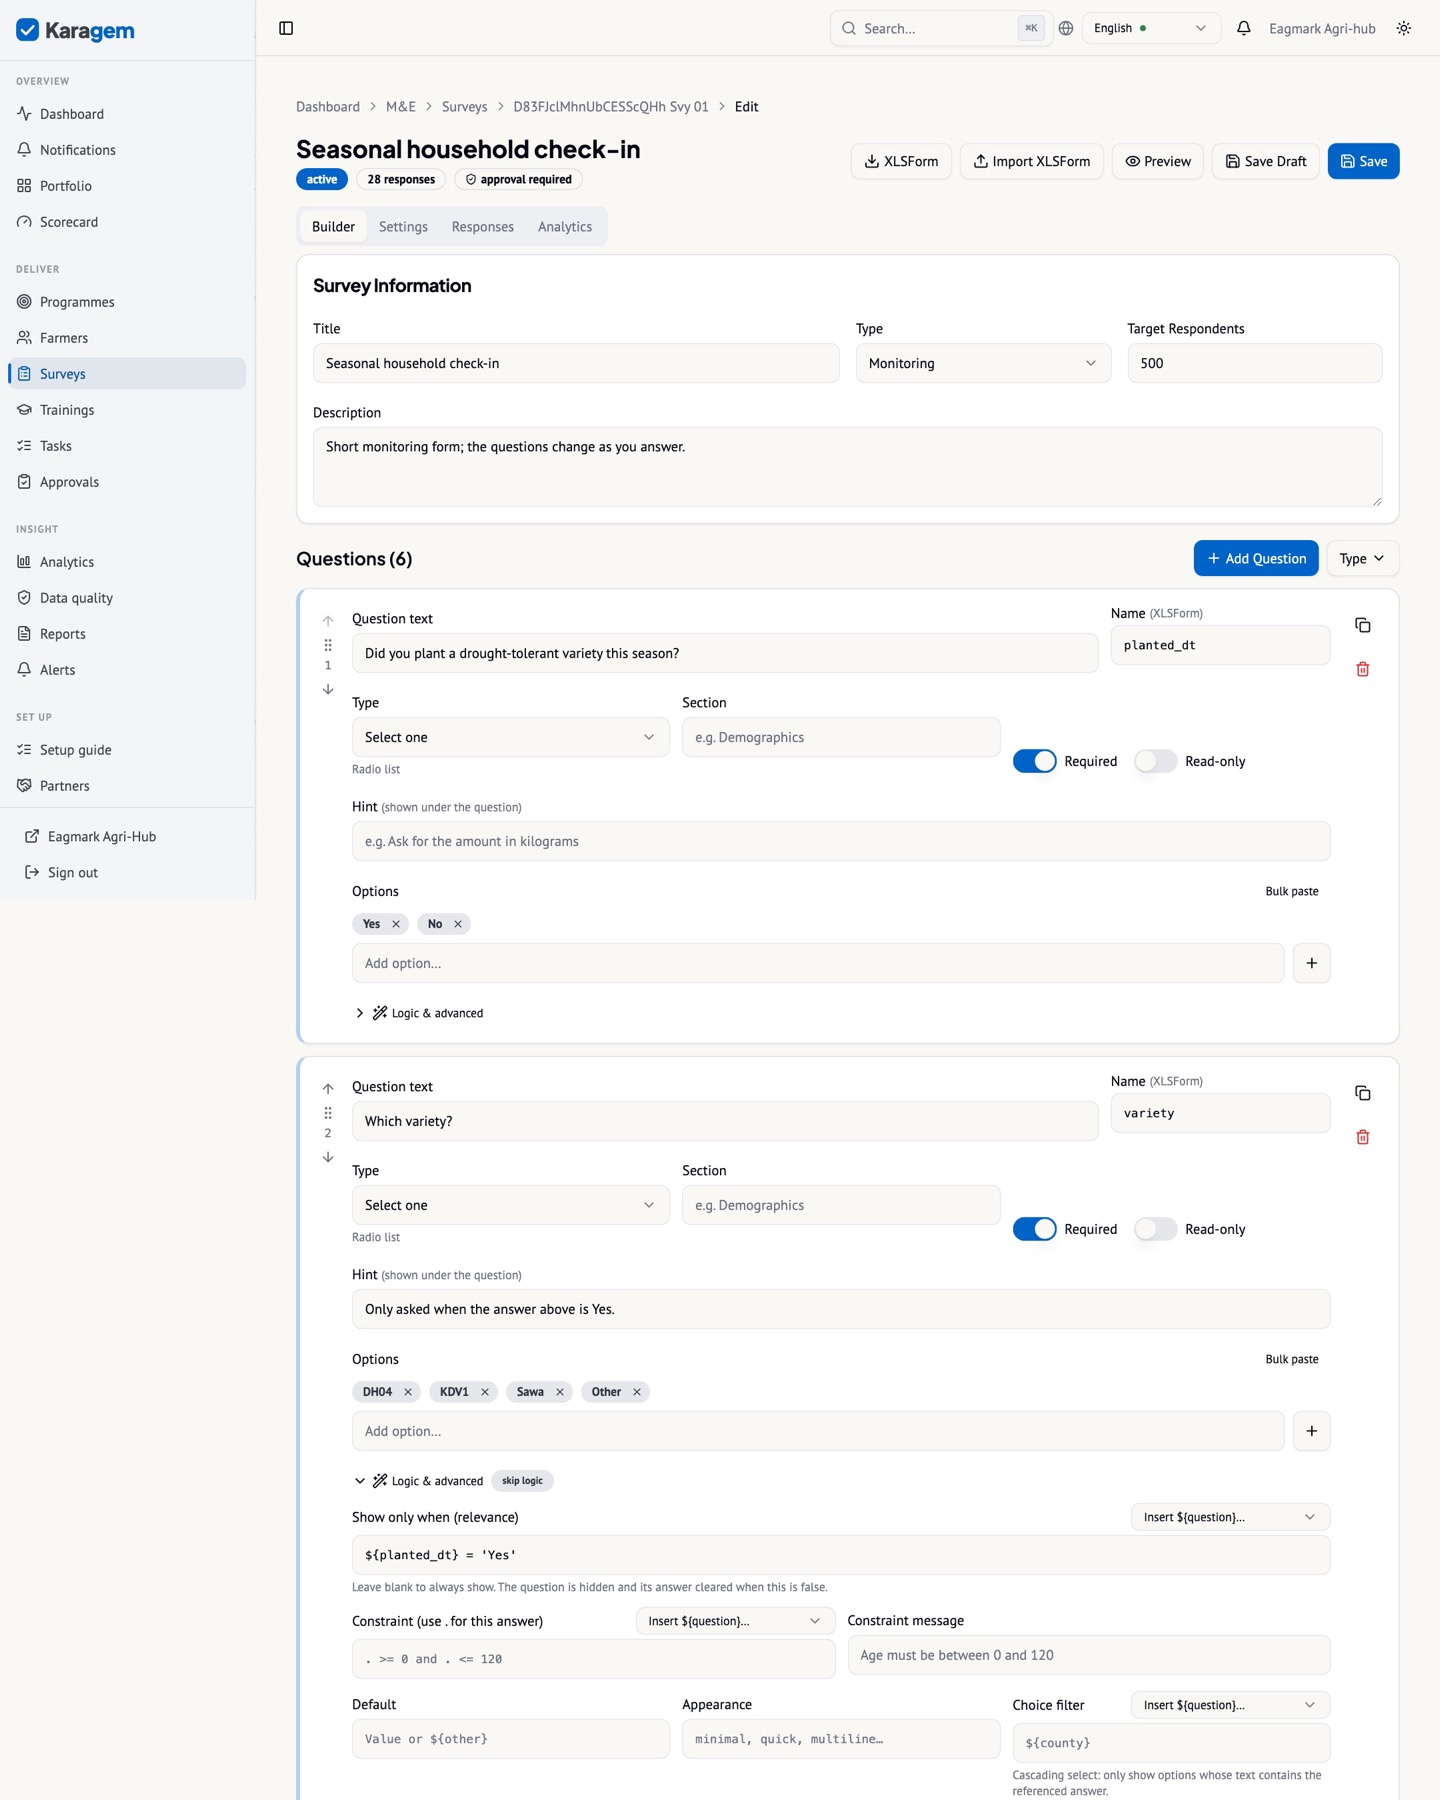
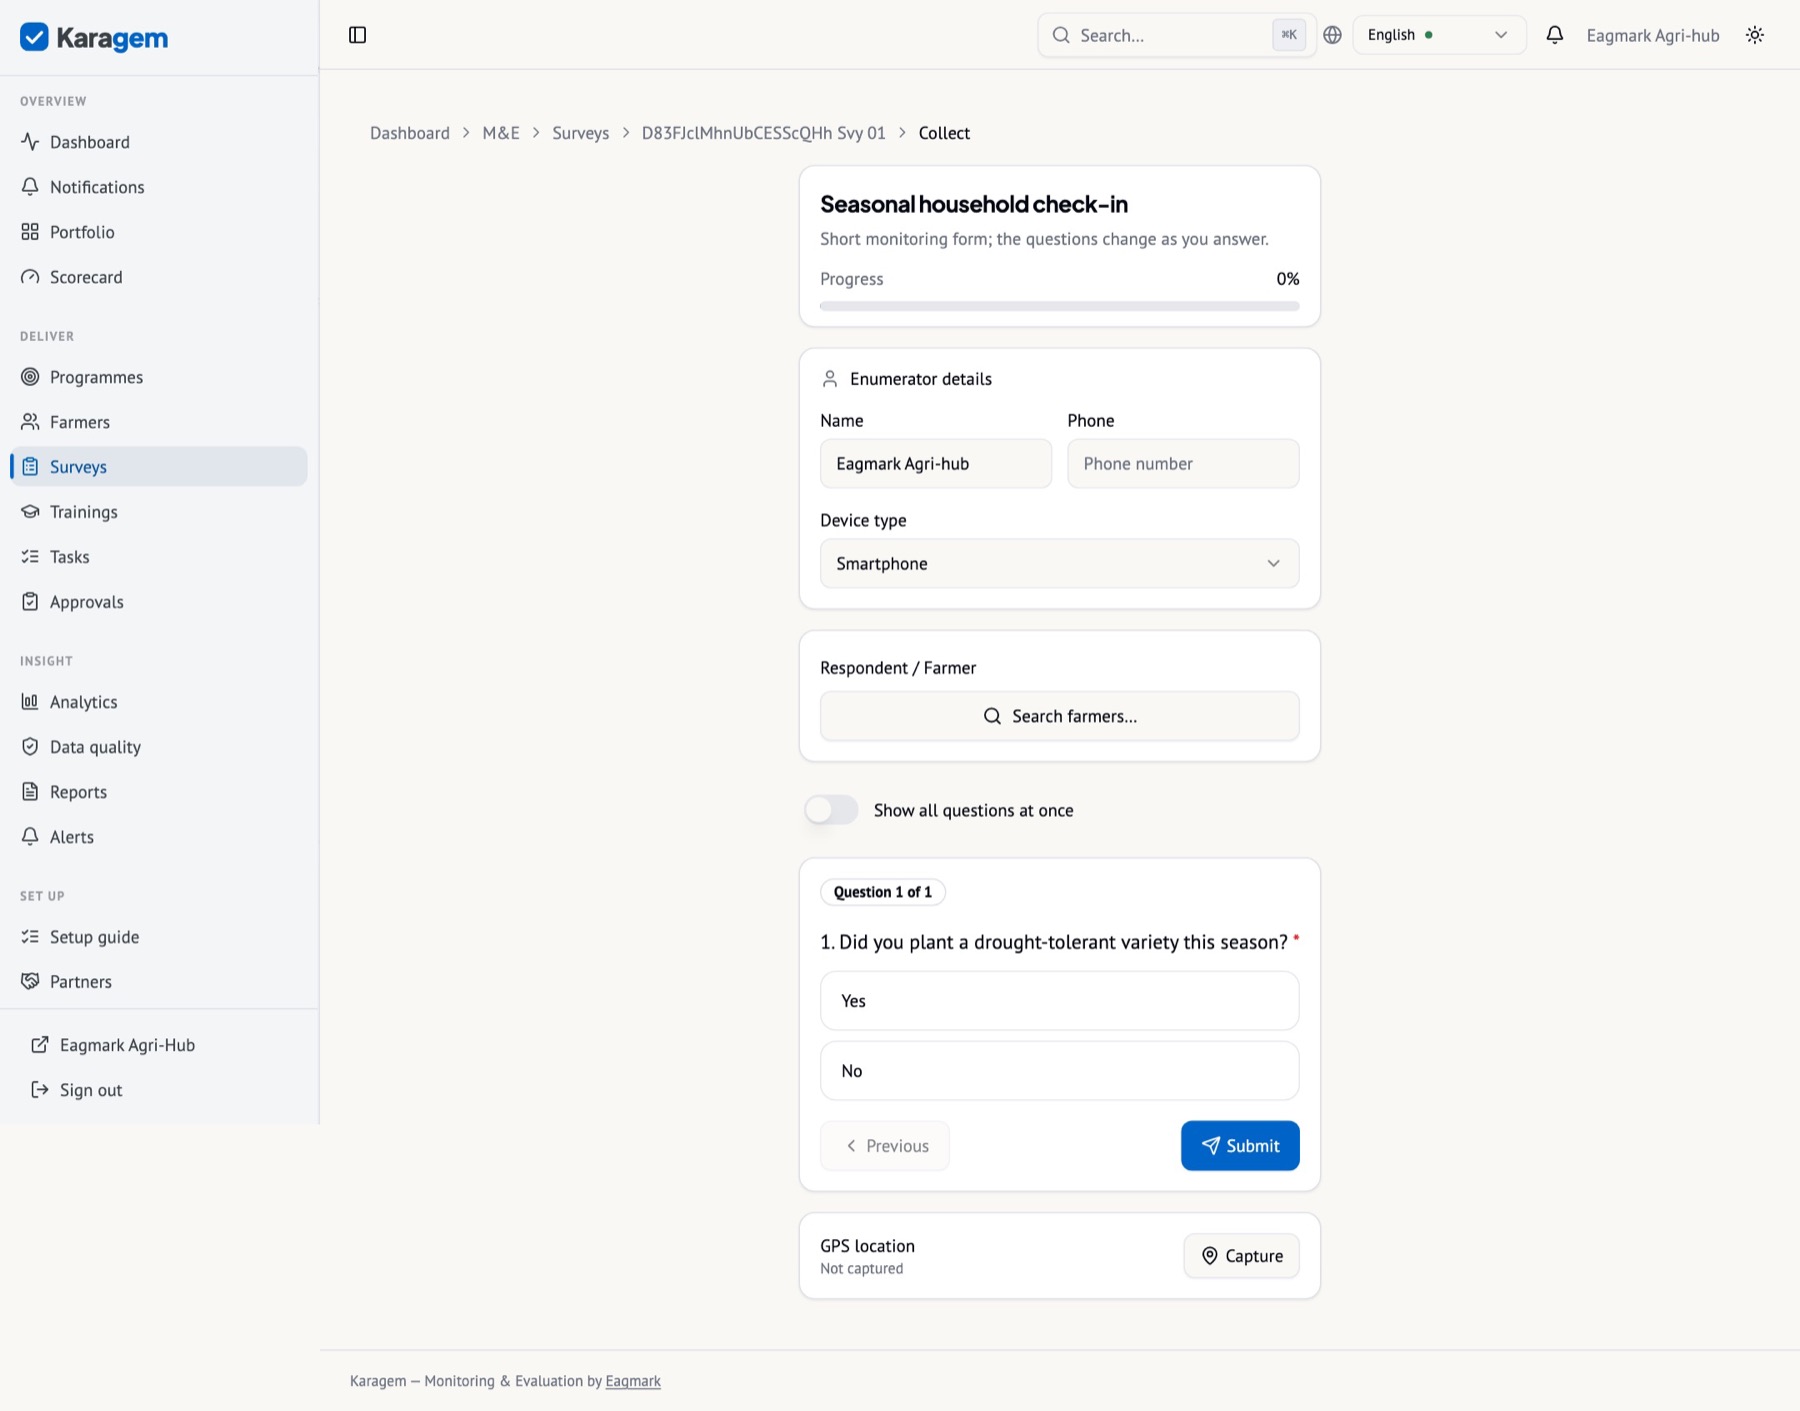
The builder is XLSForm-grade: twenty question types (text, numbers, single and multiple choice, rating, Likert, ranking, date/time, GPS, photo, signature, barcode, audio, notes, calculations, grids and repeat groups), skip logic written as relevance expressions, constraints with your own messages, calculations that fill themselves in as the enumerator types, and sections. Forms round-trip to and from XLSForm, so a Kobo or ODK form imports as-is and a Karagem form can be exported to them.
Publish and collect
- Surveys → New survey (or import an XLSForm). Build the questions; use Preview to test the logic.
- Set whether responses require approval before they count.
- Publish. Enumerators see it under Collect on their phones; it is downloaded for offline use the first time they open it.
Inclusion presets: disability and consent
Two ready-made blocks cover what social-inclusion funders ask for most often: identifying disability the way the Washington Group recommends, and opening every interview with recorded, informed consent. Both are one click, bilingual (English and Kiswahili), and store values in English so results stay comparable across programmes and years.
Washington Group Short Set
Six questions on functioning — seeing, hearing, walking, remembering or concentrating, self-care and communicating — each answered No difficulty, Some difficulty, A lot of difficulty or Cannot do at all. A person has a functional difficulty when at least one answer is A lot of difficulty or Cannot do at all; that is the Washington Group cut-off and Karagem applies it for you. Nobody types the status: it is computed from the six answers, shown as a live badge on the record, and recomputed on every save, import and API write, so the standard disability fields always agree with it.
Put it on the beneficiary profile
- Settings → Profile fields → Presets → Washington Group Short Set. Seven fields are added: the six questions and the computed status, already flagged for disaggregation.
- Save. The questions now appear on the registration form, the profile, the table and the import template; the Kiswahili wording is in each field’s help text for the enumerator to read aloud.
- On any indicator, choose the disaggregation preset “Functional difficulty (Washington Group)” to report results by it.
Ask it in a survey
- Survey builder → Insert block → Washington Group Short Set. Choose English, Kiswahili or both.
- An intro note, the six questions and a calculated status are inserted at the end of the form; the names match the profile fields, so the answers can update a beneficiary’s record.
- The block survives export to and import from XLSForm, so a Kobo or ODK form carries it unchanged.
Informed consent
The consent block opens a survey with a statement the enumerator reads aloud — who is asking, why, that taking part is voluntary, that answers are confidential and handled under the data-protection law named in Settings (for example, Kenya’s Data Protection Act 2019) — followed by the decision, separate consent for audio recording and for photographs (never assumed), a signature or mark, an optional verbal-consent recording for respondents who cannot sign, the name of the person who read the statement, and a note that ends the interview politely on refusal.
Add it
- Survey builder → Insert block → Informed consent. The organisation’s name is pre-filled; add the purpose and how long the interview takes.
- Leave the consent gate on: every other question stays hidden until consent is Yes, so a refusal ends the interview without collecting anything.
- If you add questions later, Insert block offers “Re-apply consent gate” so the new ones wait for consent too.
The sample programme ships with the Washington Group fields on its beneficiaries, so the badge, the disaggregation and the import template can be seen before you add the preset to your own organisation.
Collecting on a phone, offline
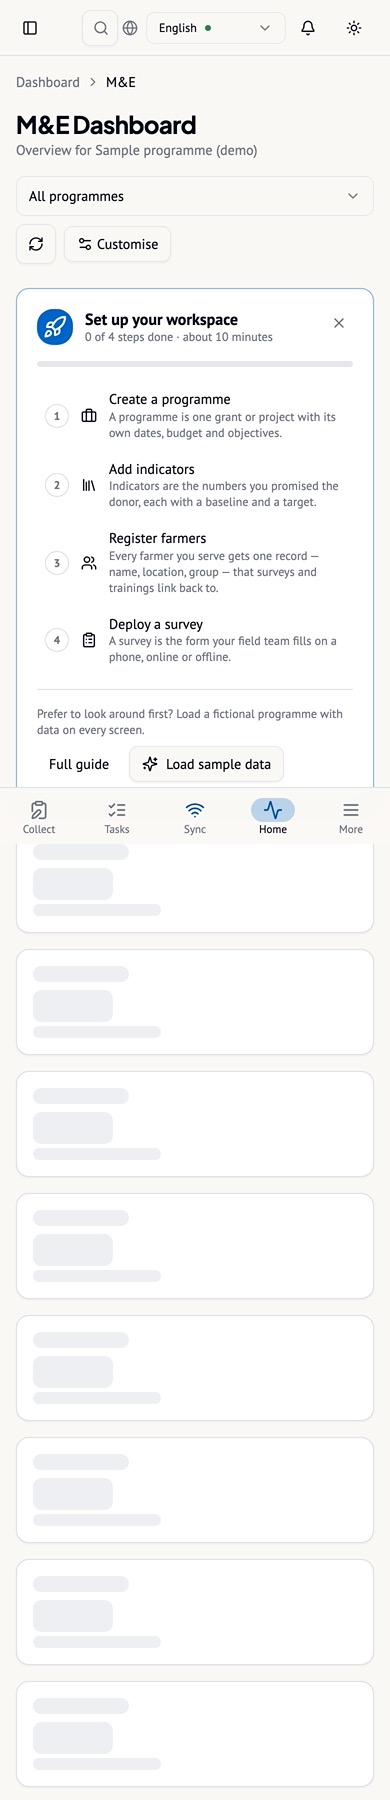
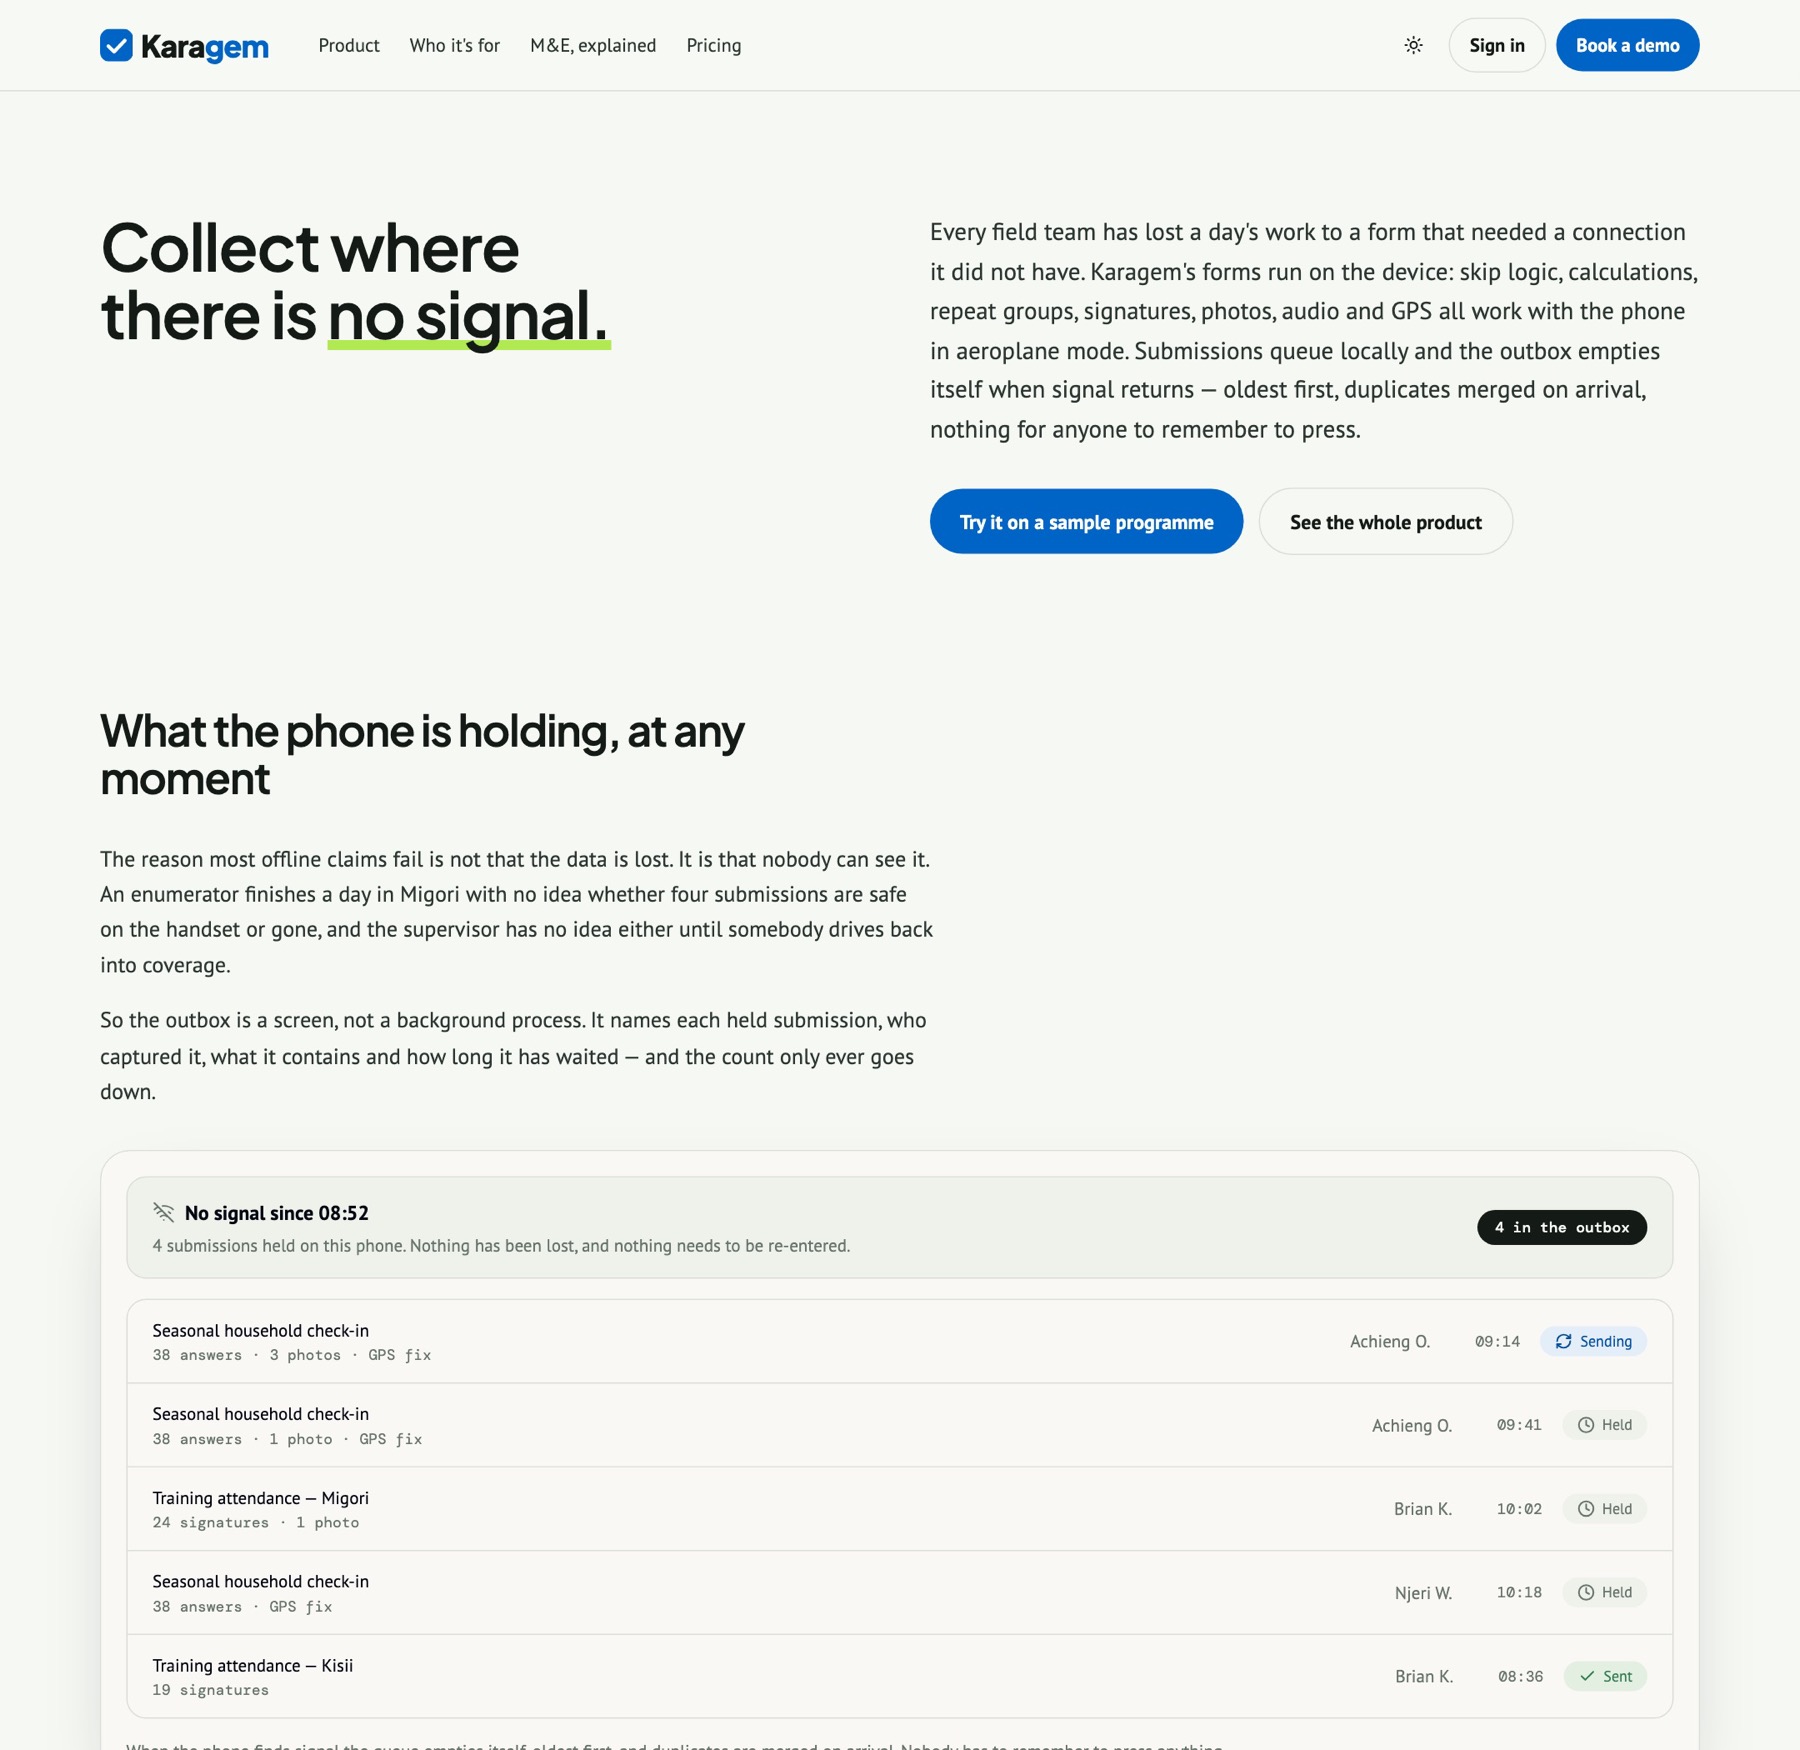
Karagem installs as an app on Android and iOS — from the browser as a progressive web app, or from the stores. On a phone it opens on Collect: the surveys assigned to you, the outbox, and a large Sync button. With no signal every submission, photo, signature and GPS fix is held on the device; when the network returns the queue empties itself, oldest first, and duplicates are merged on arrival. Nothing has to be re-entered.
Install on a phone
- Android — open me.eagmark.net in Chrome, tap the install card (or the browser menu → Add to Home screen). On iPhone — Safari → Share → Add to Home Screen.
- Sign in once. Open each survey you will collect while online so it is cached.
- Collect. The outbox count shows what is held; tap Sync when you are back in range, or let it sync itself.
Field officers can be given access to a single programme only (Chapter IX), and each enumerator collects under their own account, so every submission carries who captured it, on which device, and how long the interview took.
Trainings and attendance
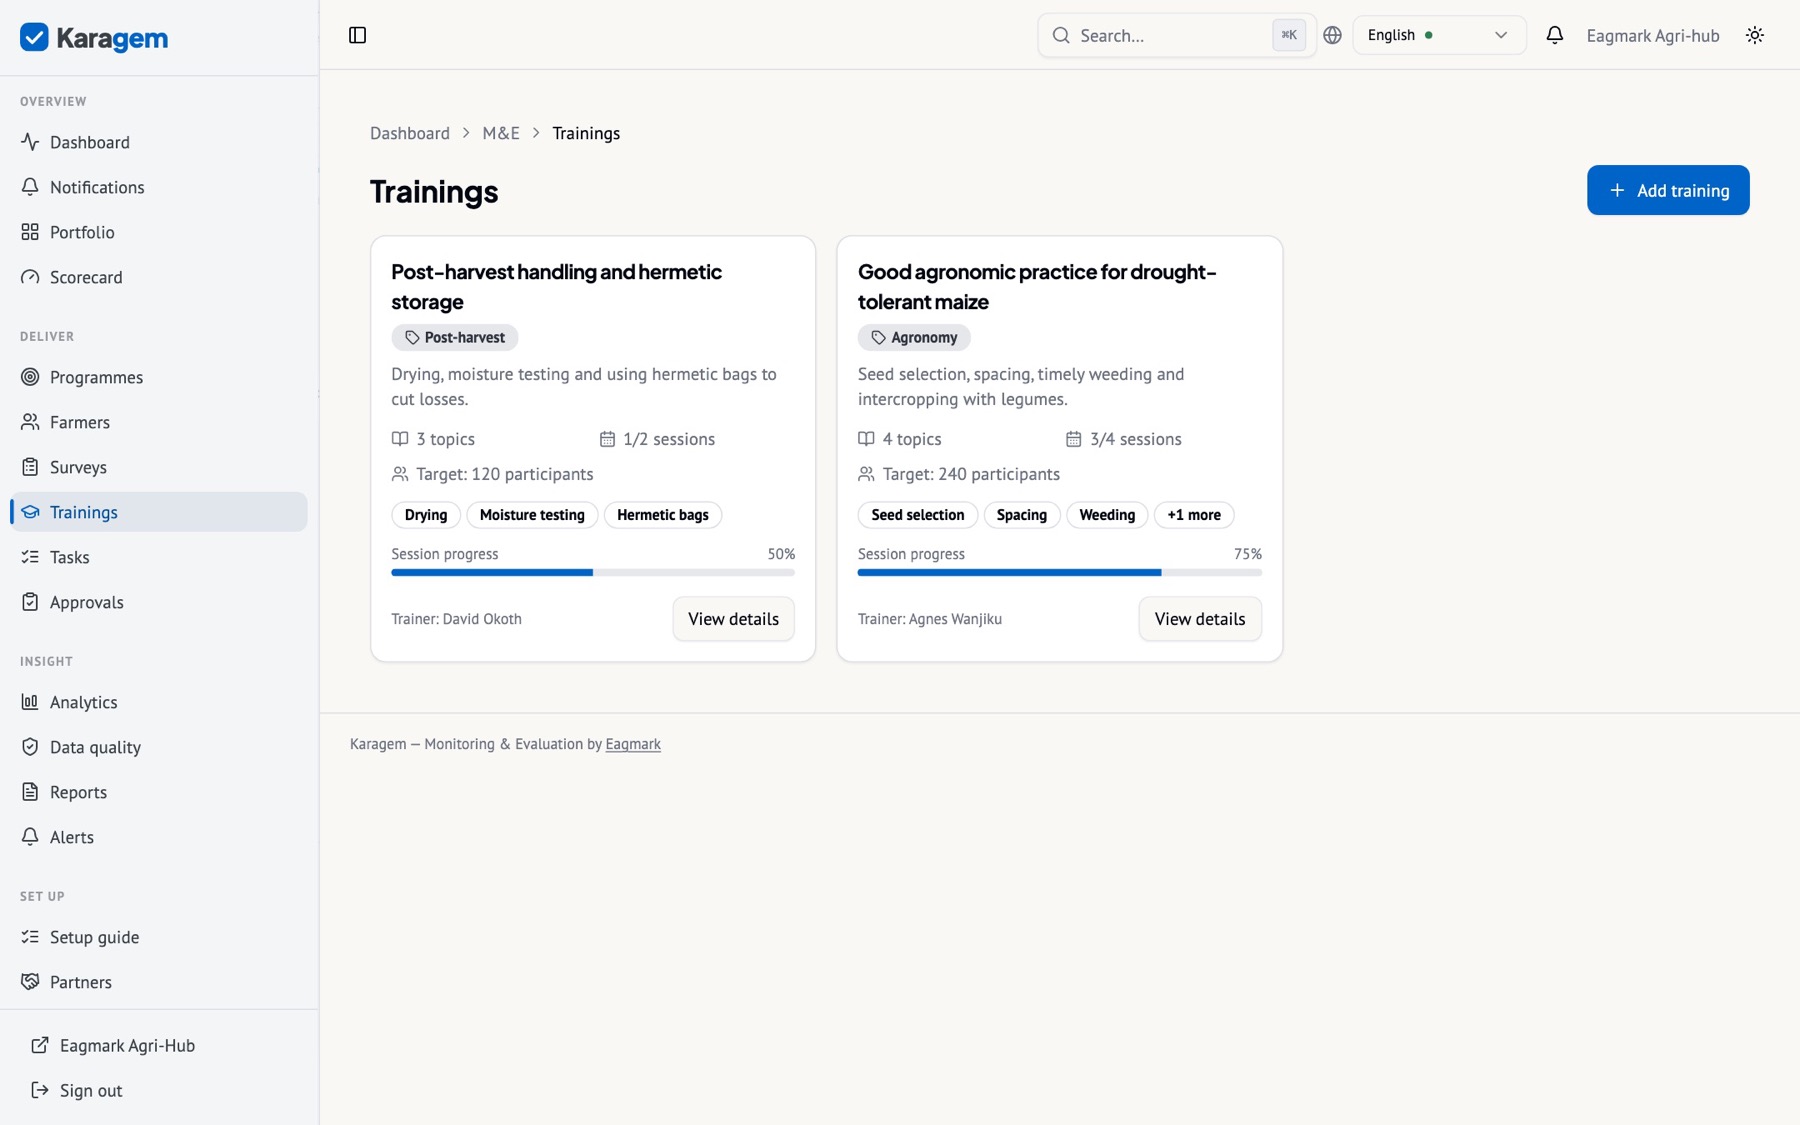
Attendance feeds indicators whose data source names training attendance, so “trainings delivered” and “people trained” update without anyone typing a number.
Integrations: Kobo, ODK, Google Sheets, SurveyCTO
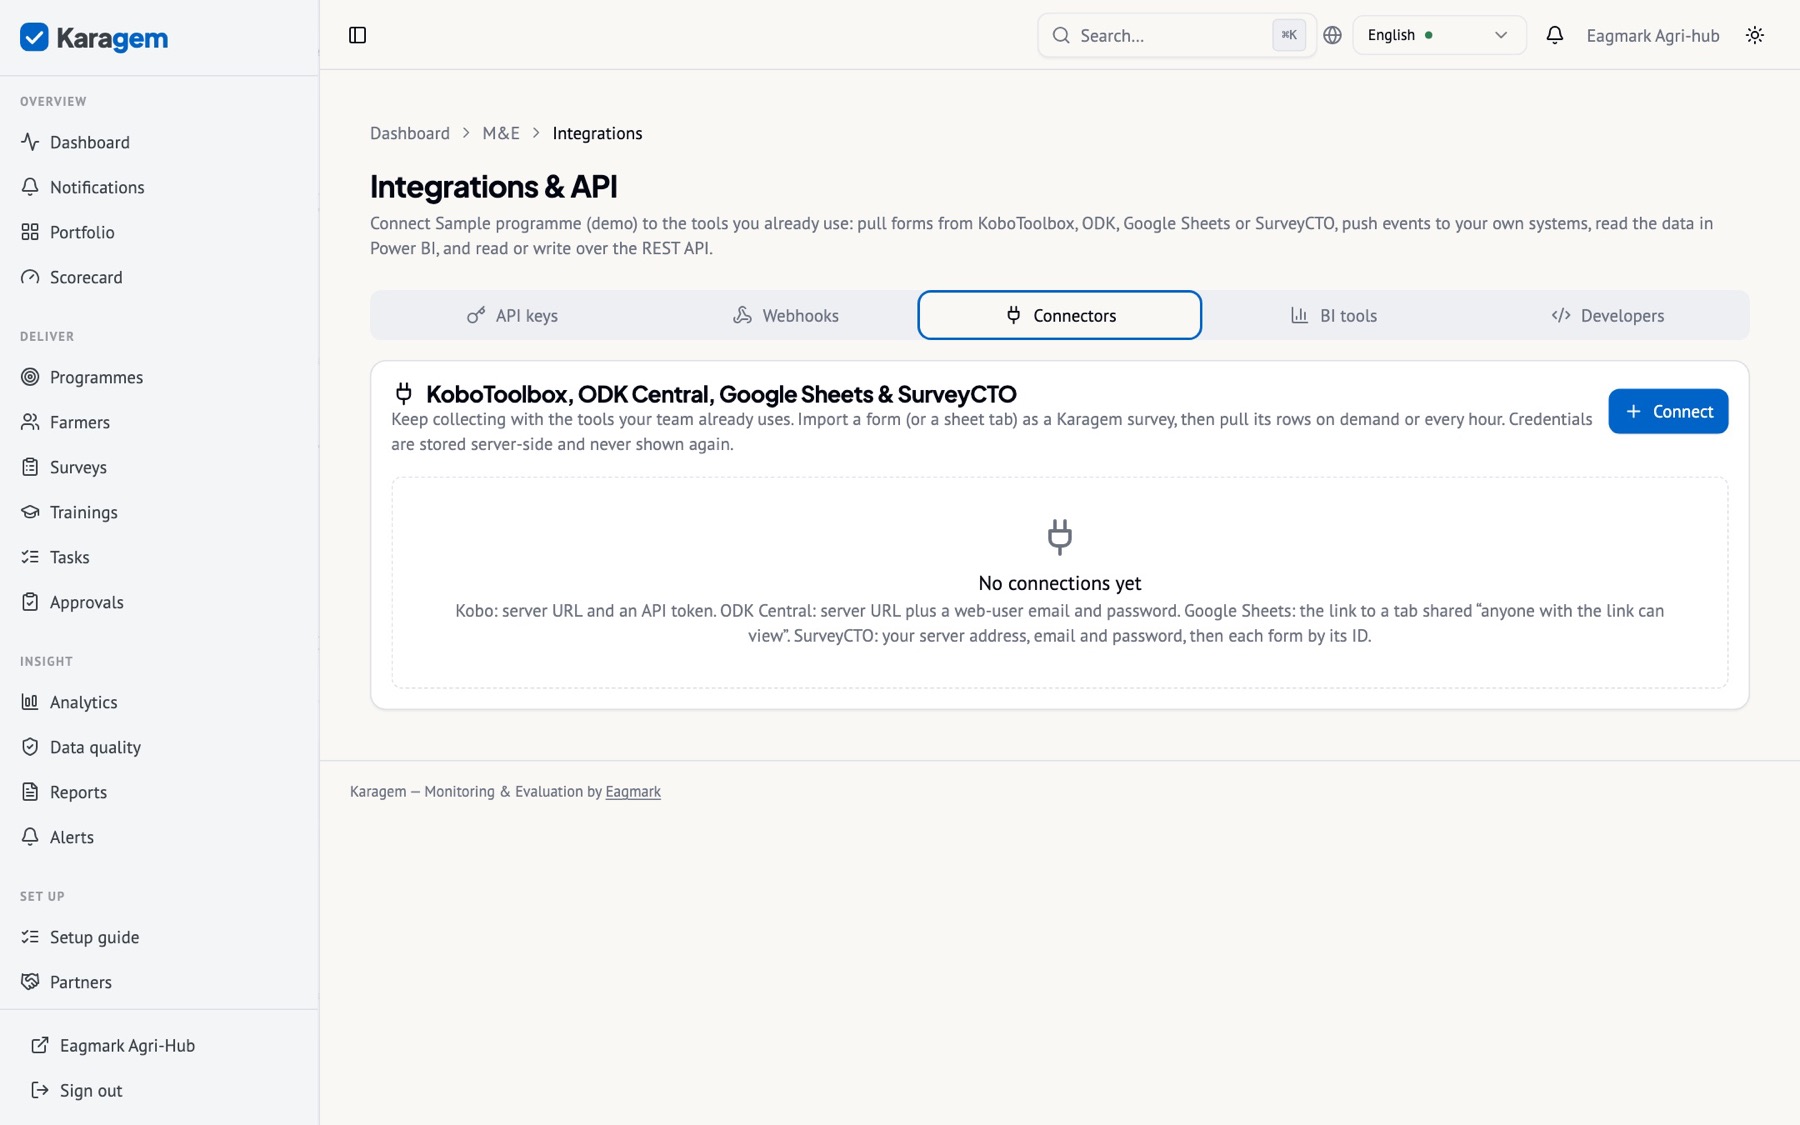
Teams that already collect with KoboToolbox, ODK Central, SurveyCTO or a shared Google Sheet keep doing so. Karagem connects to the server once, imports the form as a survey inside one of your programmes, and from then on pulls the submissions — on demand or every hour — so they arrive exactly where a Karagem survey’s own responses arrive: under that programme, in that survey’s results, on the dashboard, in exports and reports, and in the API.
From a Kobo or ODK form to your programme
- Integrations → Connectors → Connect. Choose the provider, give the connection a name, and paste the server address and the credentials (a Kobo API token; an ODK Central web-user email and password; a SurveyCTO account; a Google Sheet link shared “anyone with the link can view”). Test connection confirms it and counts the forms it can see.
- Browse forms and, next to the one you want, choose Import as survey. Pick the programme it belongs to. The form’s questions, choice lists, repeat groups, skip logic and labels become a Karagem survey in that programme, already published. (SurveyCTO has no list-forms call: type the form ID instead.)
- Or choose Link to an existing survey when you built the survey in Karagem first — for example by importing the same XLSForm — and only want its submissions. Question names must match; unmatched columns are reported, not silently dropped.
- Press Import submissions. Every submission becomes a response in that survey; a re-run adds only what is new, because each response carries the source’s own submission id. Turn on Hourly to let Karagem pull by itself.
- The result dialog says what came in, what was already present, what failed and why, how many responses were linked to beneficiaries, and whether any are waiting in Approvals — with buttons straight to the responses, the approvals queue or the programme.
Where imported data goes
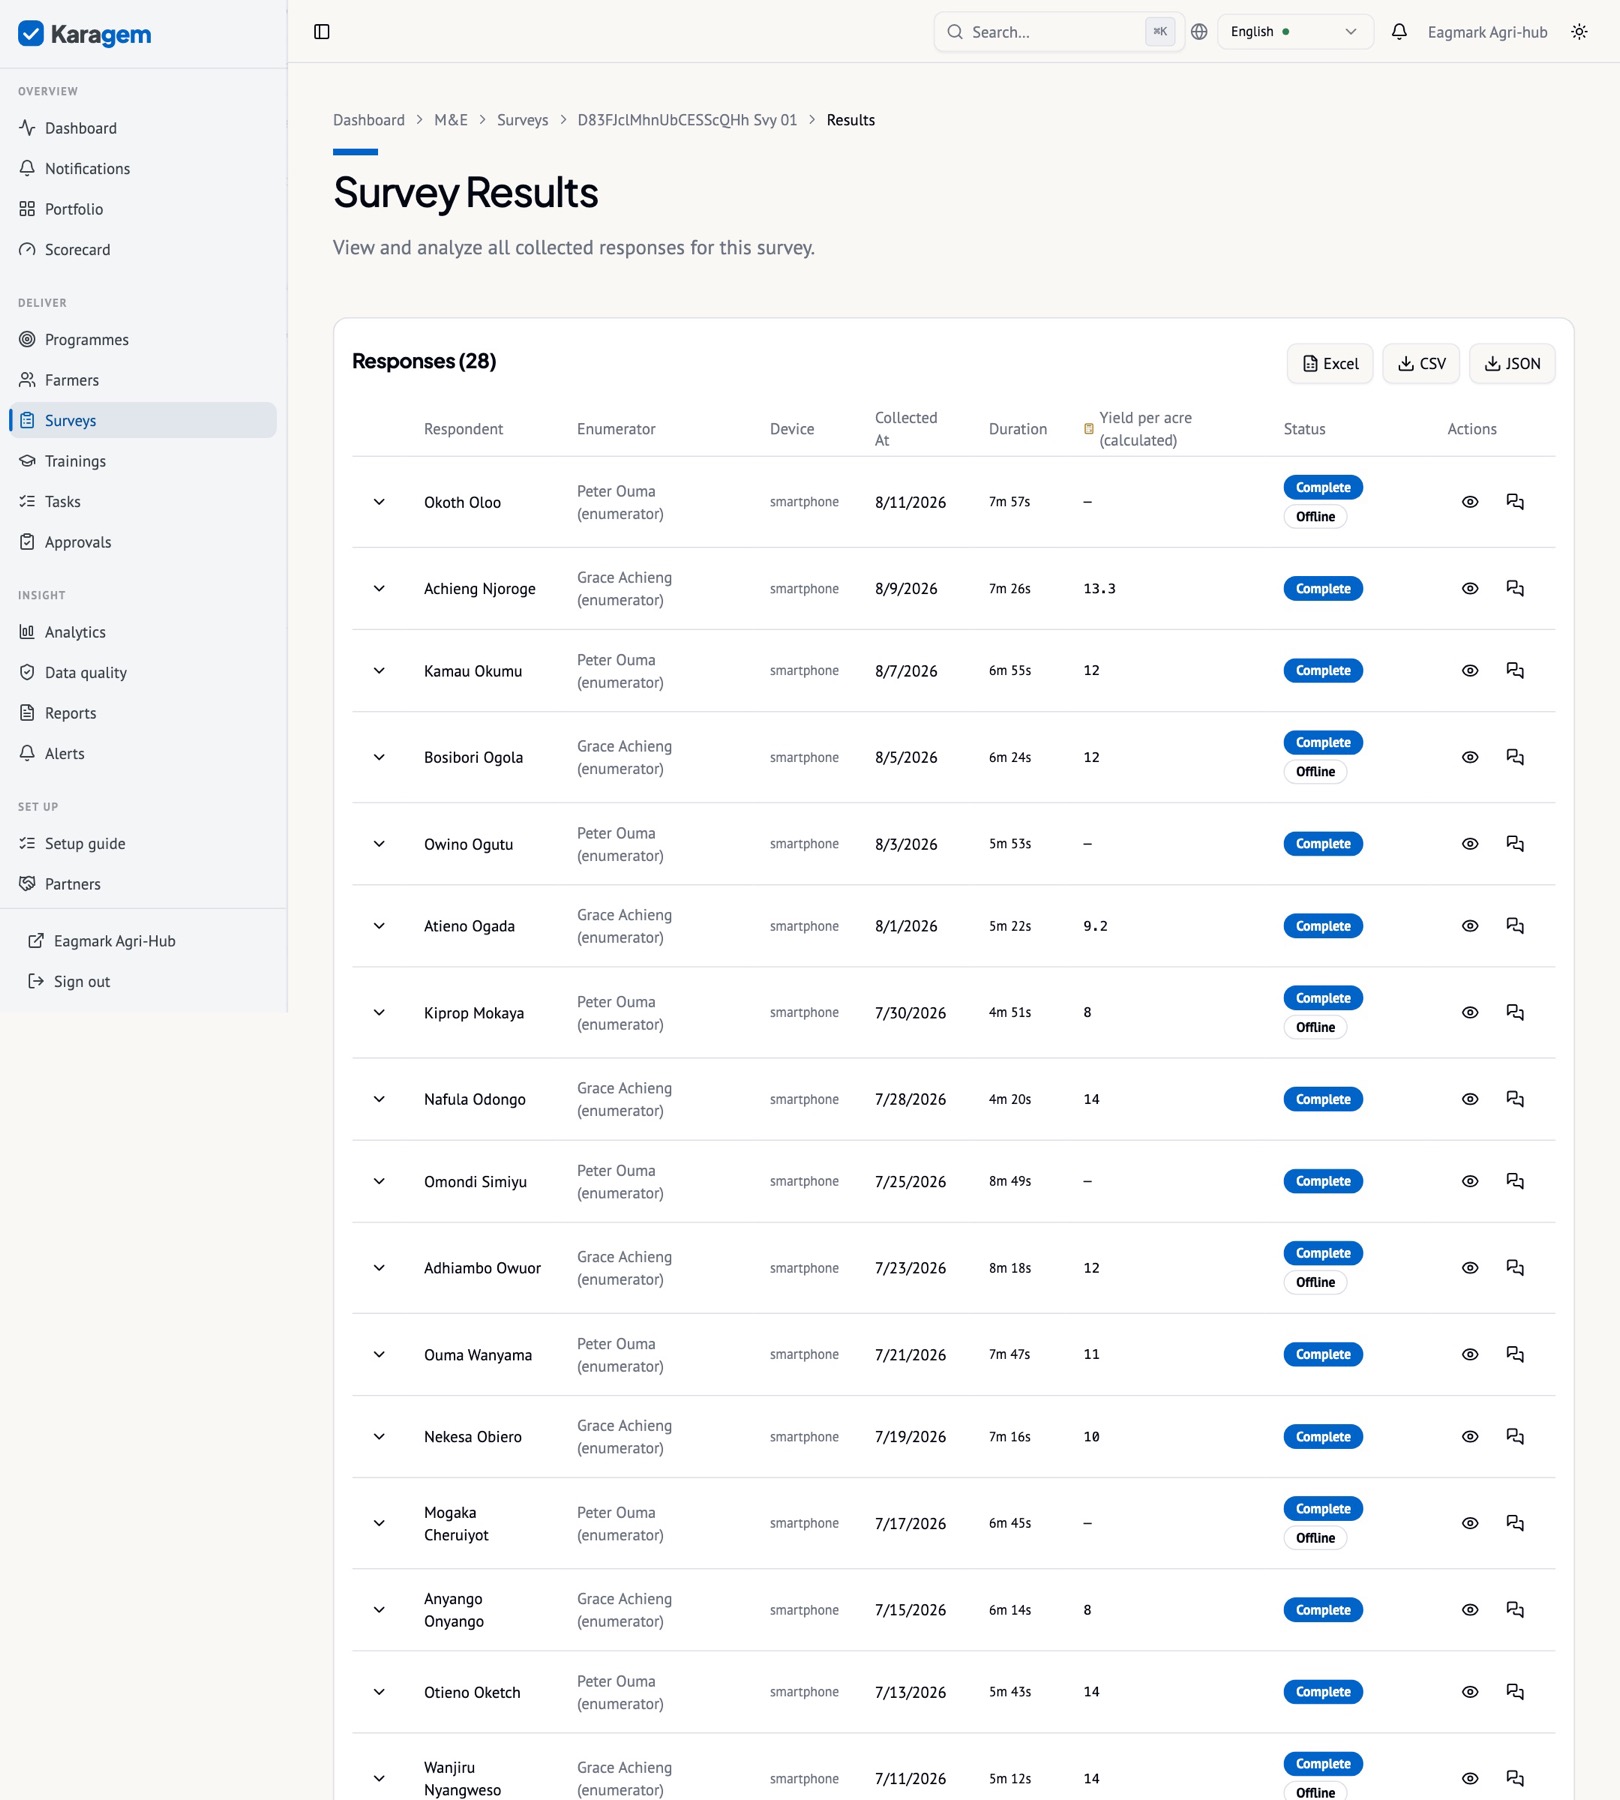
- Responses: Surveys → the survey → Results, with answers, calculated fields, GPS and the submitter; exportable to Excel, CSV or JSON, and available to the report builder and the API like any other response.
- Programme: the survey sits in the programme you chose, so the dashboard’s collection widget, the programme’s analytics, the coverage map and the donor link count its responses.
- Beneficiaries: when the form has a question named phone_number (or phone, mobile, telephone) or national_id (or id_number, beneficiary_id, participant_id, household_id…), each response is linked to the registry record with that phone or ID, and appears on that person’s profile under Surveys answered. A phone matches on its last nine digits, so “+254 712 …”, “0712 …” and “712 …” are the same person. Nothing is guessed from names.
- Approvals: if the survey requires approval, every imported response waits in Approvals before it counts, exactly as a phone submission would.
- Indicators: values are not written to indicators automatically. Record them from the results (Programme → Objectives → Record value), import them in bulk (Objectives → Import), or push them through the API; the change log shows which survey the number came from.
- Change log and webhooks: each pull is logged on the survey (source, form, counts), and a survey.response.created event is sent for every new response.
| Source | What you provide | How forms are found | Notes |
|---|---|---|---|
| KoboToolbox | Server URL and an API token | Browsed from the server | Questions, choice labels, repeat groups and attachments are mapped. |
| ODK Central | Server URL, web-user email and password | Browsed per project | XForm labels are read so questions keep their text. |
| Google Sheets | A link to a tab shared “anyone with the link can view” | One connection = one tab | Questions are inferred from the header row and a sample of values. |
| SurveyCTO | Server address, account email and password | Added by form ID | SurveyCTO has no list-forms call, so each form is named by its ID; submissions are read in wide format. |
| XLSForm file | A form built in Excel, Kobo or ODK Build | Survey builder → Import XLSForm | Becomes a Karagem survey; the same file can be linked to a connector for its submissions. |
| Excel / CSV files | A spreadsheet | Beneficiaries → Import; Programme → Objectives → Import | Registry rows and indicator values have templates; survey responses come through a connector, not a file. |
If something does not line up
| You see | What it means | What to do |
|---|---|---|
| “No answers matched the survey questions” | The linked survey’s question names differ from the form’s field names. | Import the form as a new survey instead, or rename the survey’s questions to the form’s names (Builder → question → Name). |
| Fewer responses than the source shows | Rows without a submission id, or already present from an earlier pull. | Check the errors list in the result dialog; “already present” rows are not a problem. |
| No beneficiary links | The form has no phone or ID question with a recognised name. | Add a phone_number or national_id question to the form, or rename the existing one; links apply from the next pull. |
| Form changed on the server | New questions are not in the survey yet. | Import submissions again: the definition is re-read on every pull, and new fields are added to the survey. |
| Test connection fails | Wrong server address, token or account, or the account cannot see the project. | Check the address includes https://, regenerate the token, and confirm the account’s project role. |
Tip. Give the form a phone_number question and the survey “requires approval” before the first pull: every imported response then links to the right person and passes through the same review as field submissions.
The REST API and webhooks
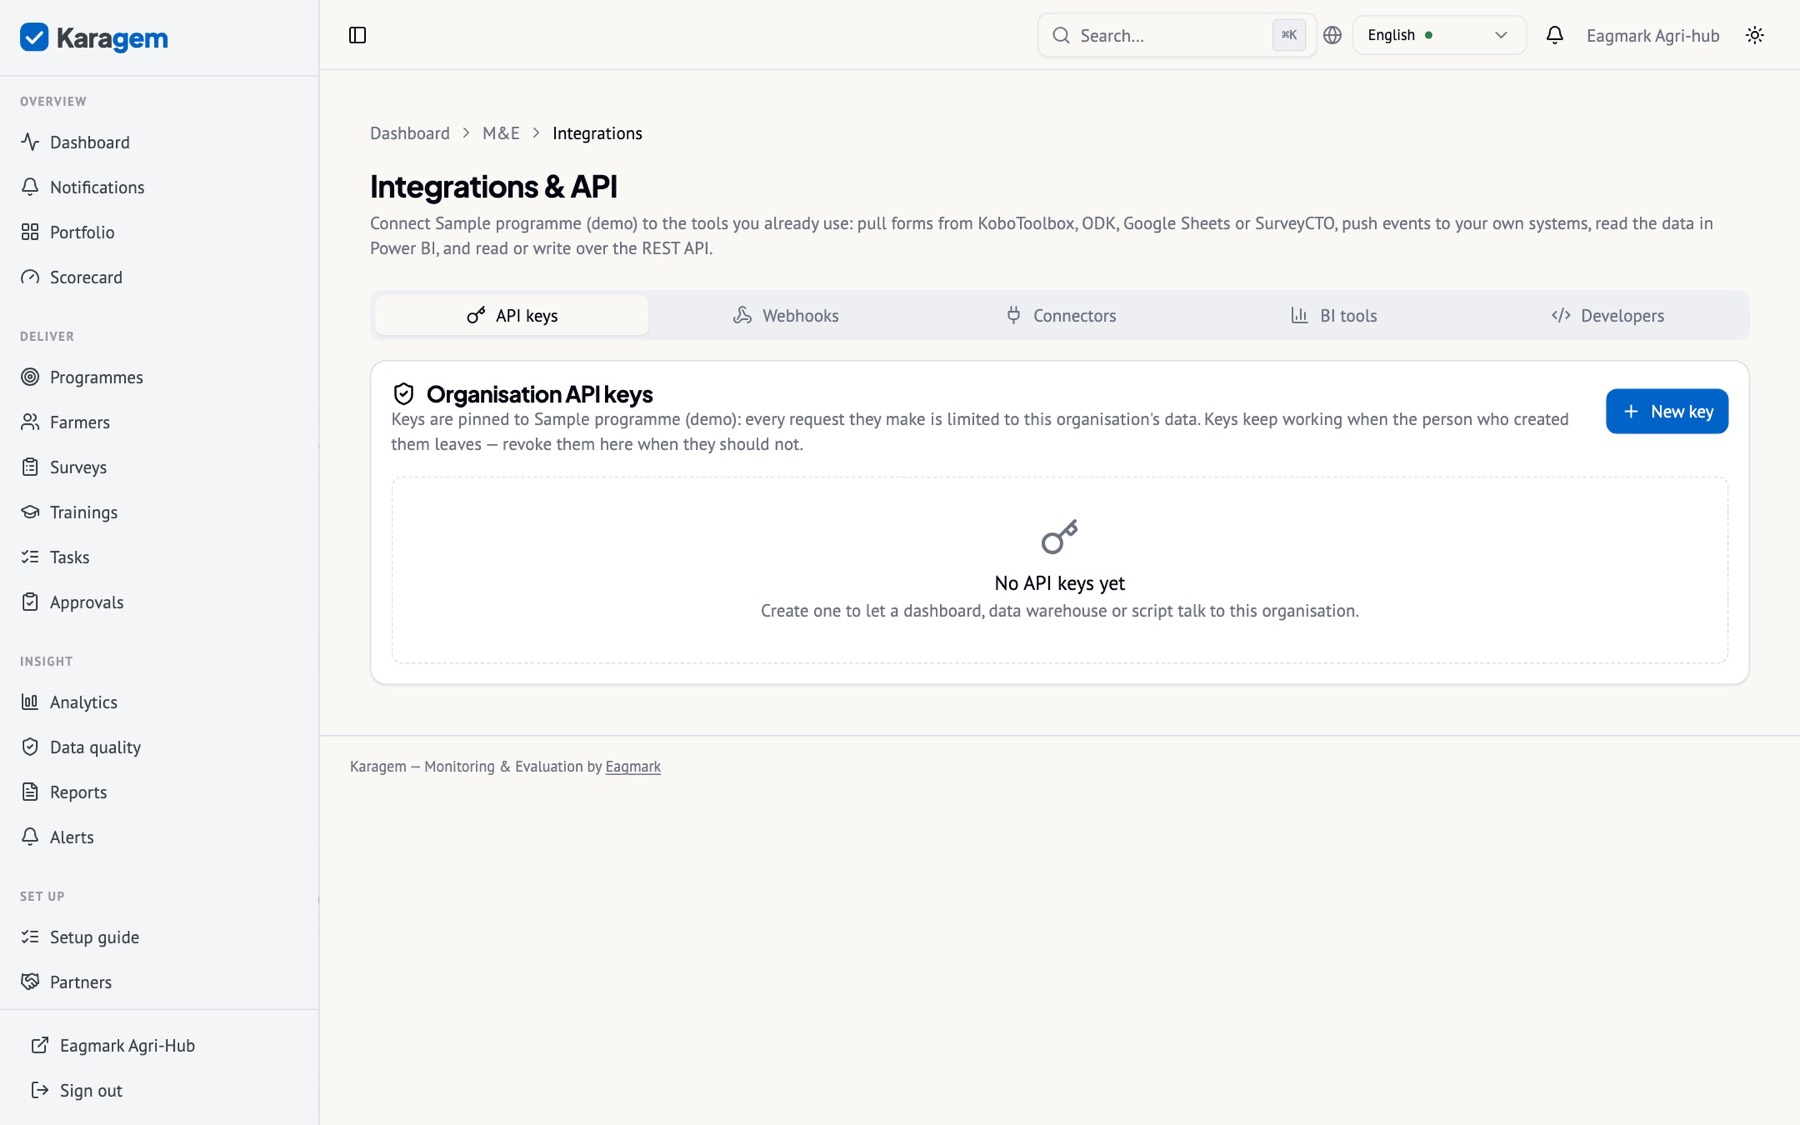
Everything in the workspace is reachable at /api/v1/me/* with a Bearer key: programmes, indicators and values (read and write, single and bulk), beneficiaries, surveys and responses, trainings, alerts, tasks, and a CSV export of indicators with full history. The OpenAPI specification is served by the API itself and the Developers tab shows a curl example for every endpoint. Webhooks deliver signed events — a new response, a recorded value, a fired alert, a decided approval — to your own systems with retries.
Chapter VI
Check
Approvals before a number counts, a daily quality scan, proof of where and when each visit was collected, a change log on every record, and discussion where the record is.
Approvals
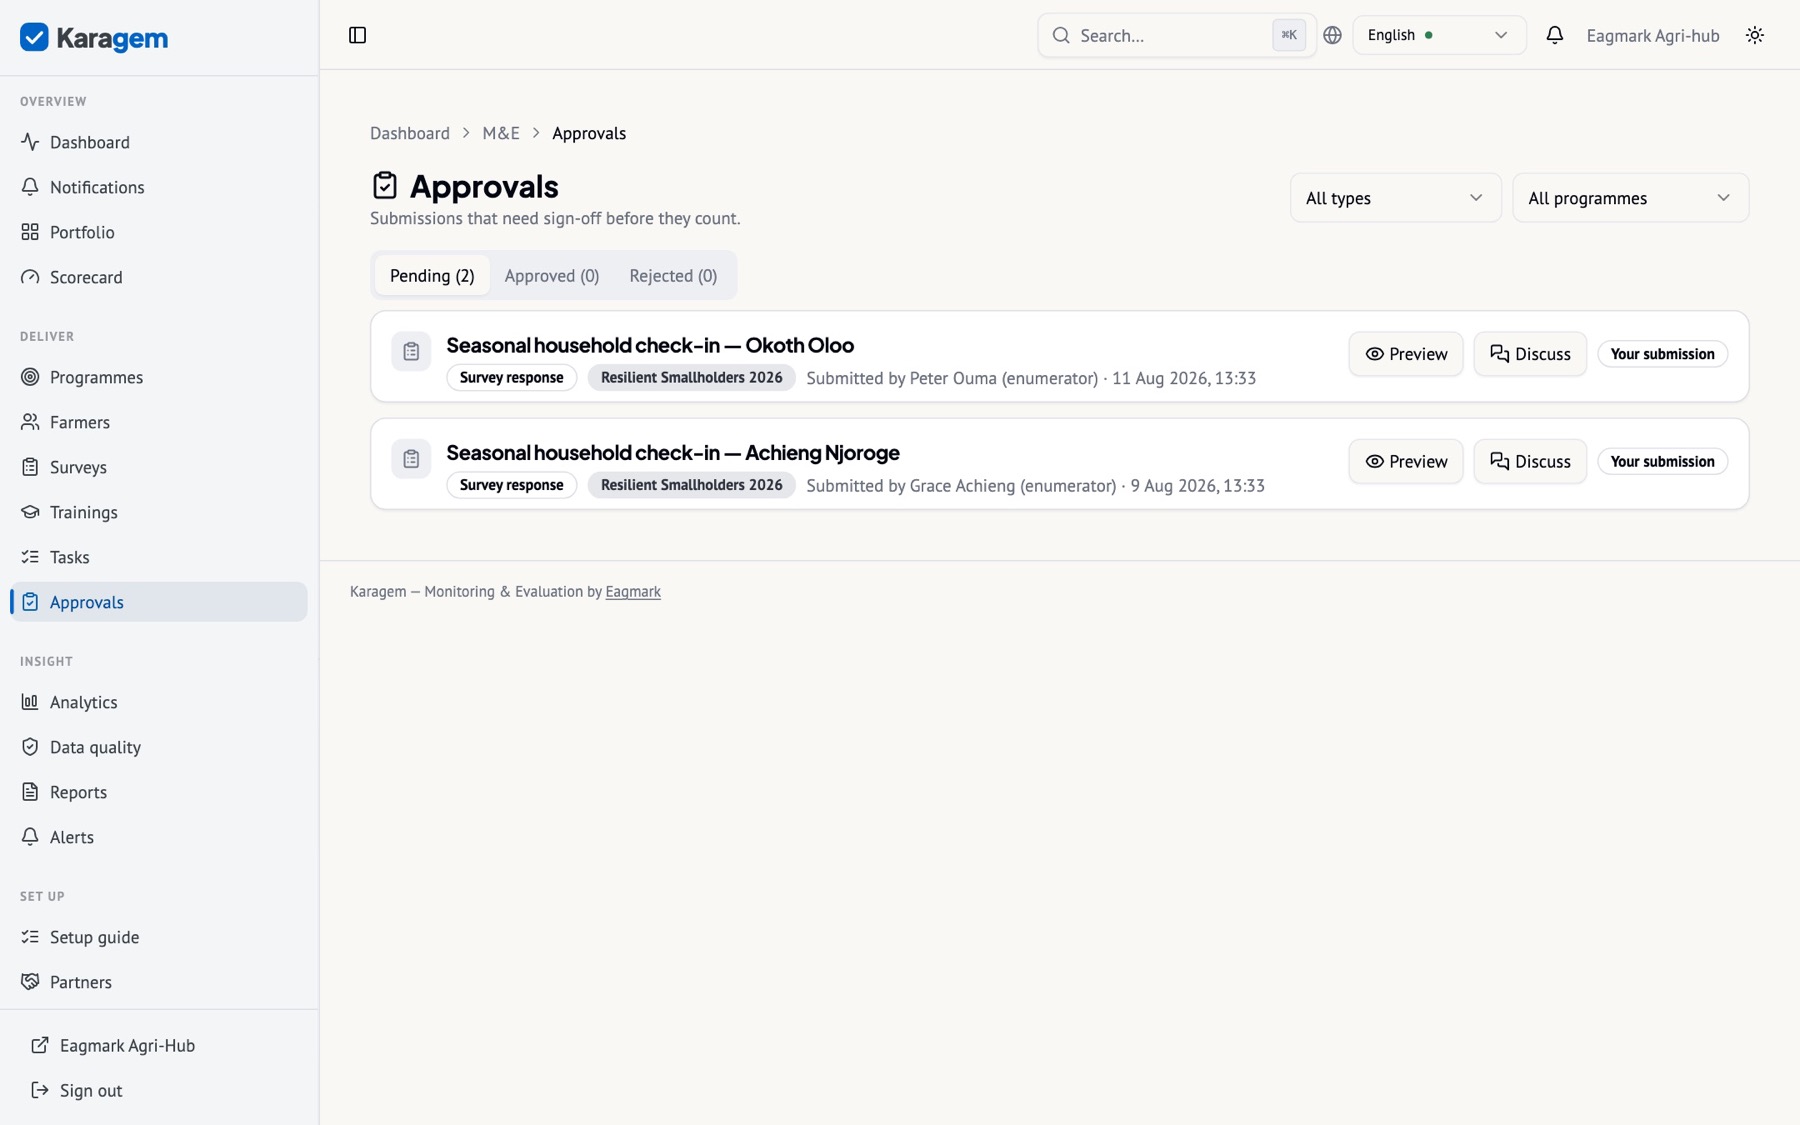
A survey can require approval; an indicator value can be submitted for approval; expenditures above the organisation’s threshold wait; new beneficiary registrations can wait. Until an M&E officer or programme manager approves, the value does not count toward the indicator and the response is flagged pending. Nobody can approve their own submission.
Decide a submission
- Approvals → Pending. Preview shows the full record.
- Approve or Reject; a rejection needs a note, which the submitter sees.
- The decision is written to the change log of both the approval and the record it decided, and fires a webhook if one is subscribed.
Data quality
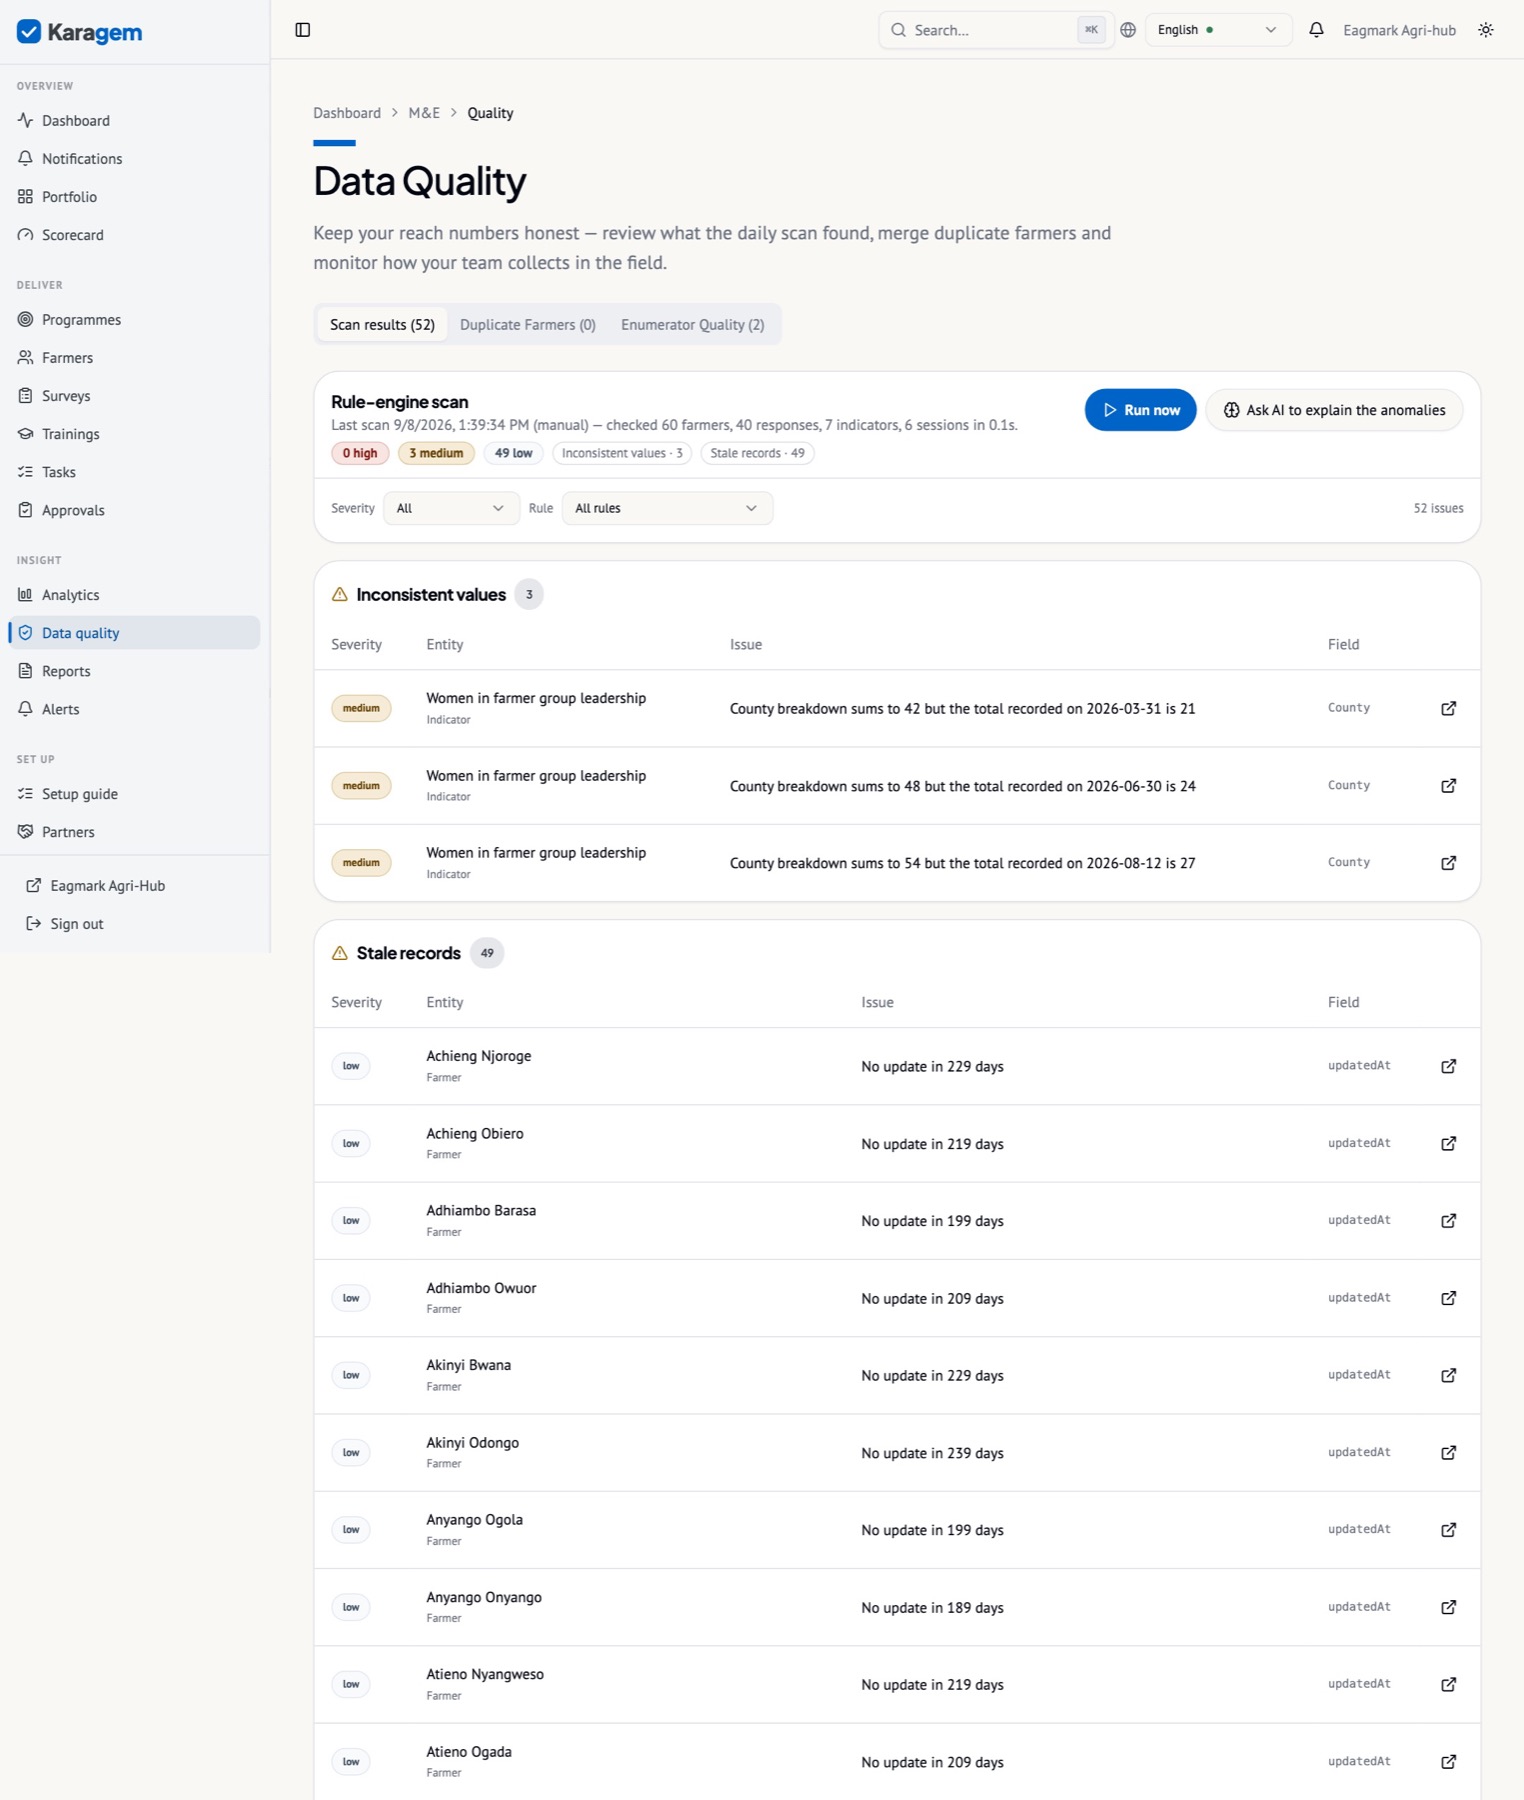
- At capture — constraints and skip logic refuse what the field cannot mean before it leaves the phone.
- On registration — a duplicate hash across identifying fields blocks obvious double registration.
- Every day — the scan checks the whole dataset against rules (duplicates, outliers, speed, staleness, missing breakdowns) and writes a score per beneficiary record and per enumerator.
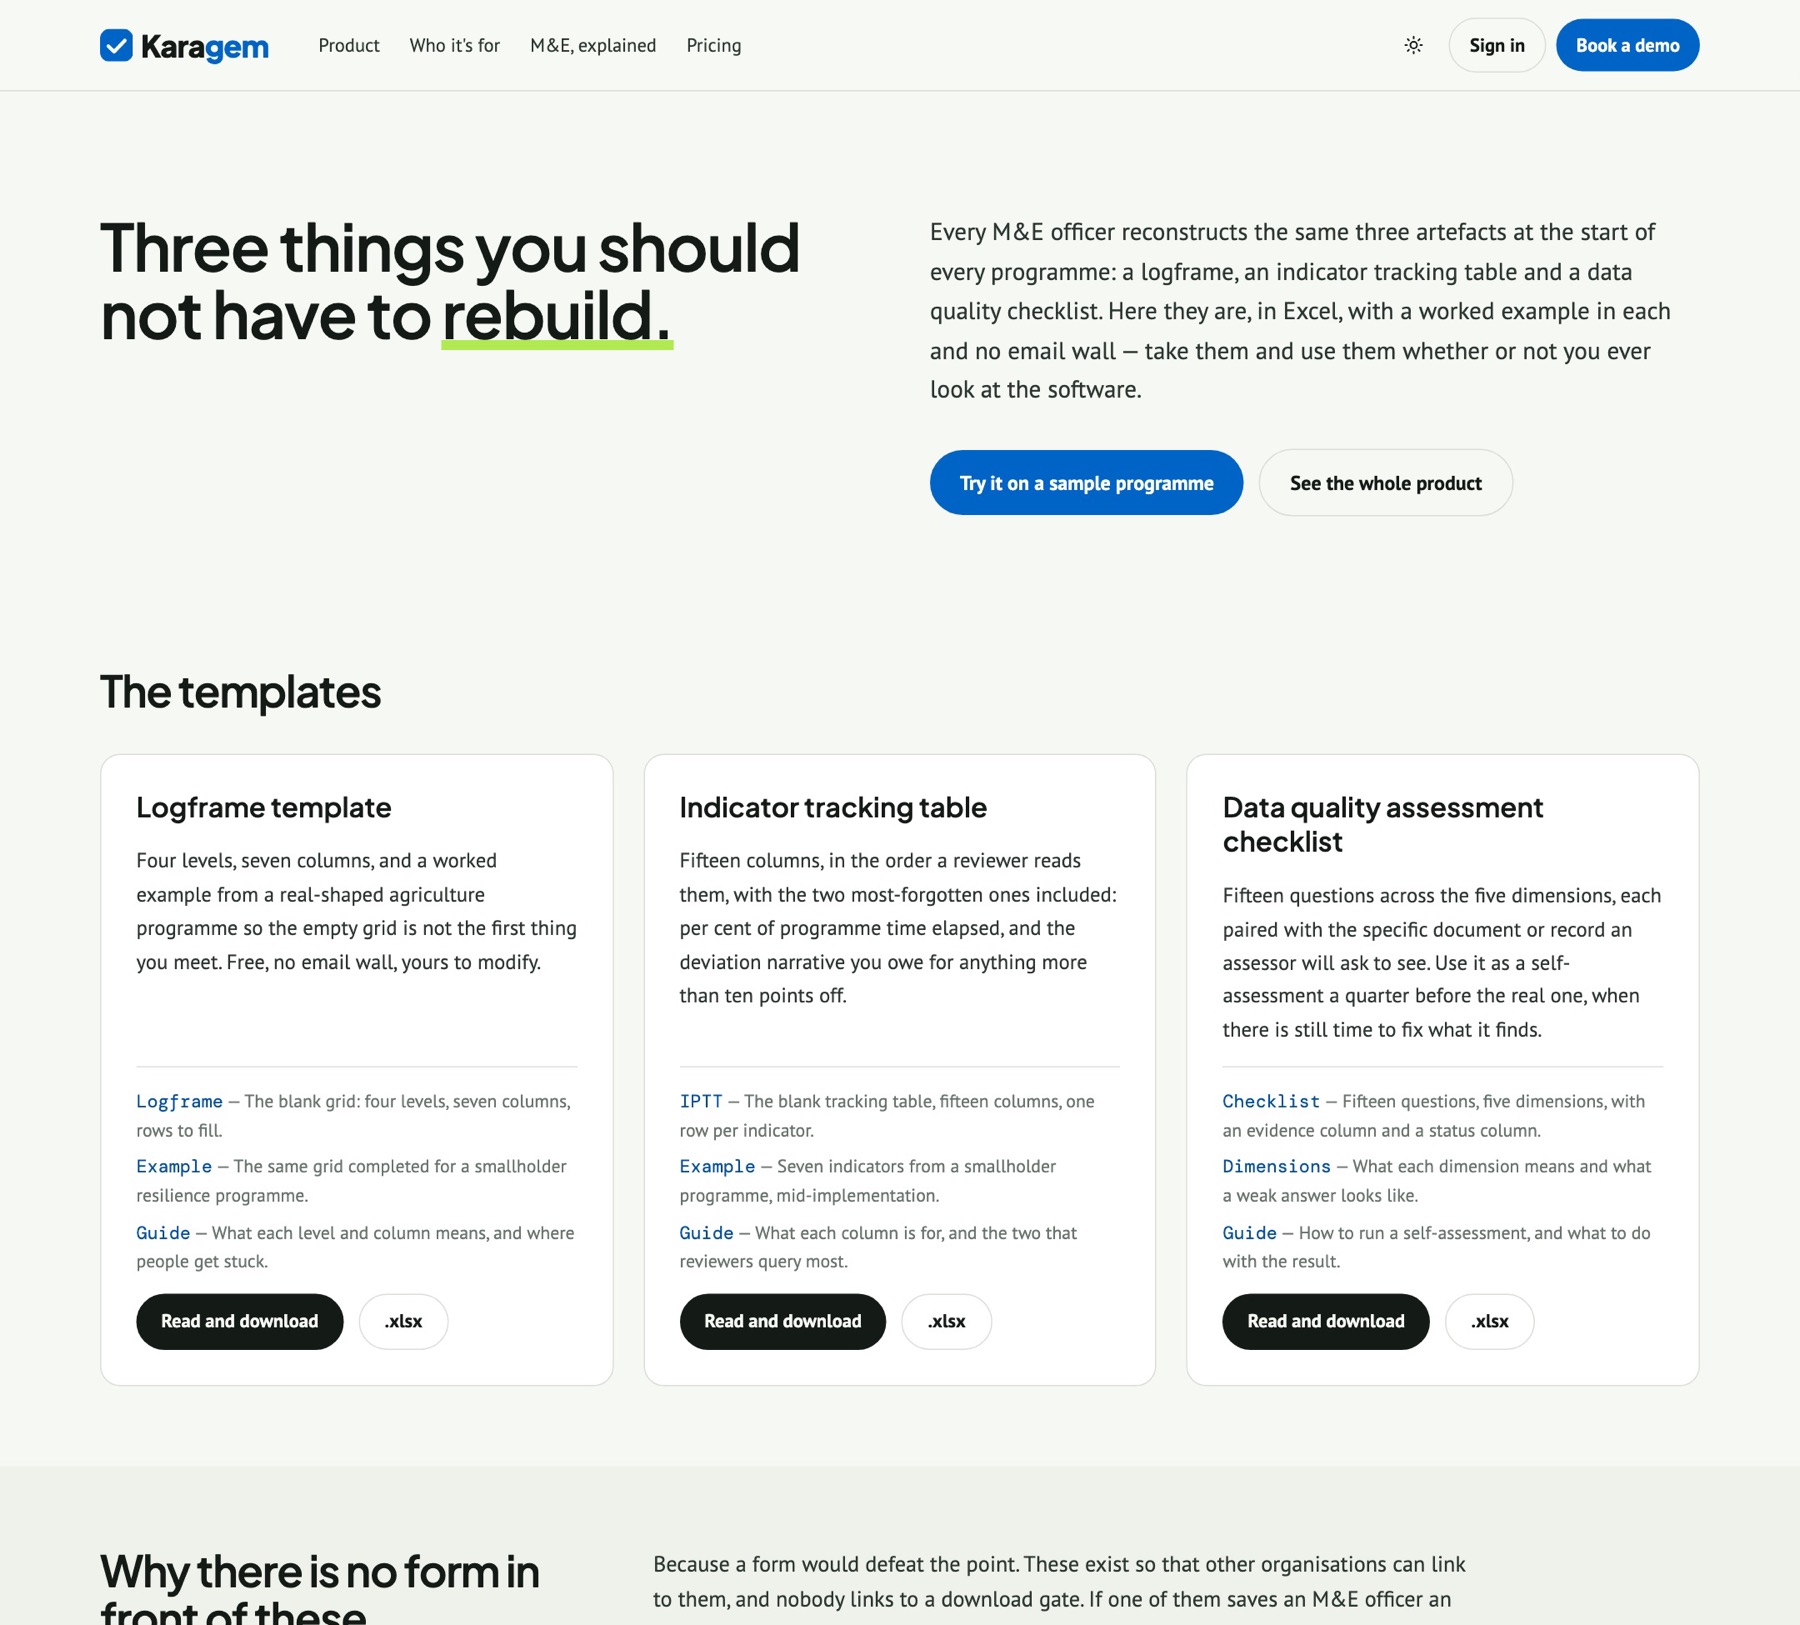
- On the DQA checklist — a free Excel checklist (me.eagmark.net/templates/dqa-checklist) structures a formal data-quality assessment against the same dimensions.
Verification: where, when and by whom
Every survey visit carries an evidence record: where it was collected, when, by whom, and proof that nothing has changed since. It is made in three steps, each with a different witness.
- On the phone, at the moment of capture — the collect form follows the GPS receiver for the whole visit and keeps the best fix, with its accuracy in metres. When the collector presses submit, the phone writes a statement of the place, the time, the collector, the device and a fingerprint of the answers, and signs it with a key that never leaves that phone. This works with no signal: a visit held offline for a week is as well attested as one sent at once.
- On the server, when it arrives — the signature and the fingerprint are checked, and the visit is put through the trust checks below. The server’s clock is the trusted one; if the phone’s clock was wrong, the capture time is corrected by the measured difference and the correction is shown.
- In the ledger — the visit is added to an append-only chain kept for your organisation. Each entry carries the fingerprint of the one before it and the server’s signature. Change an answer, edit an entry or remove one, and the chain stops matching at a point anyone can find.
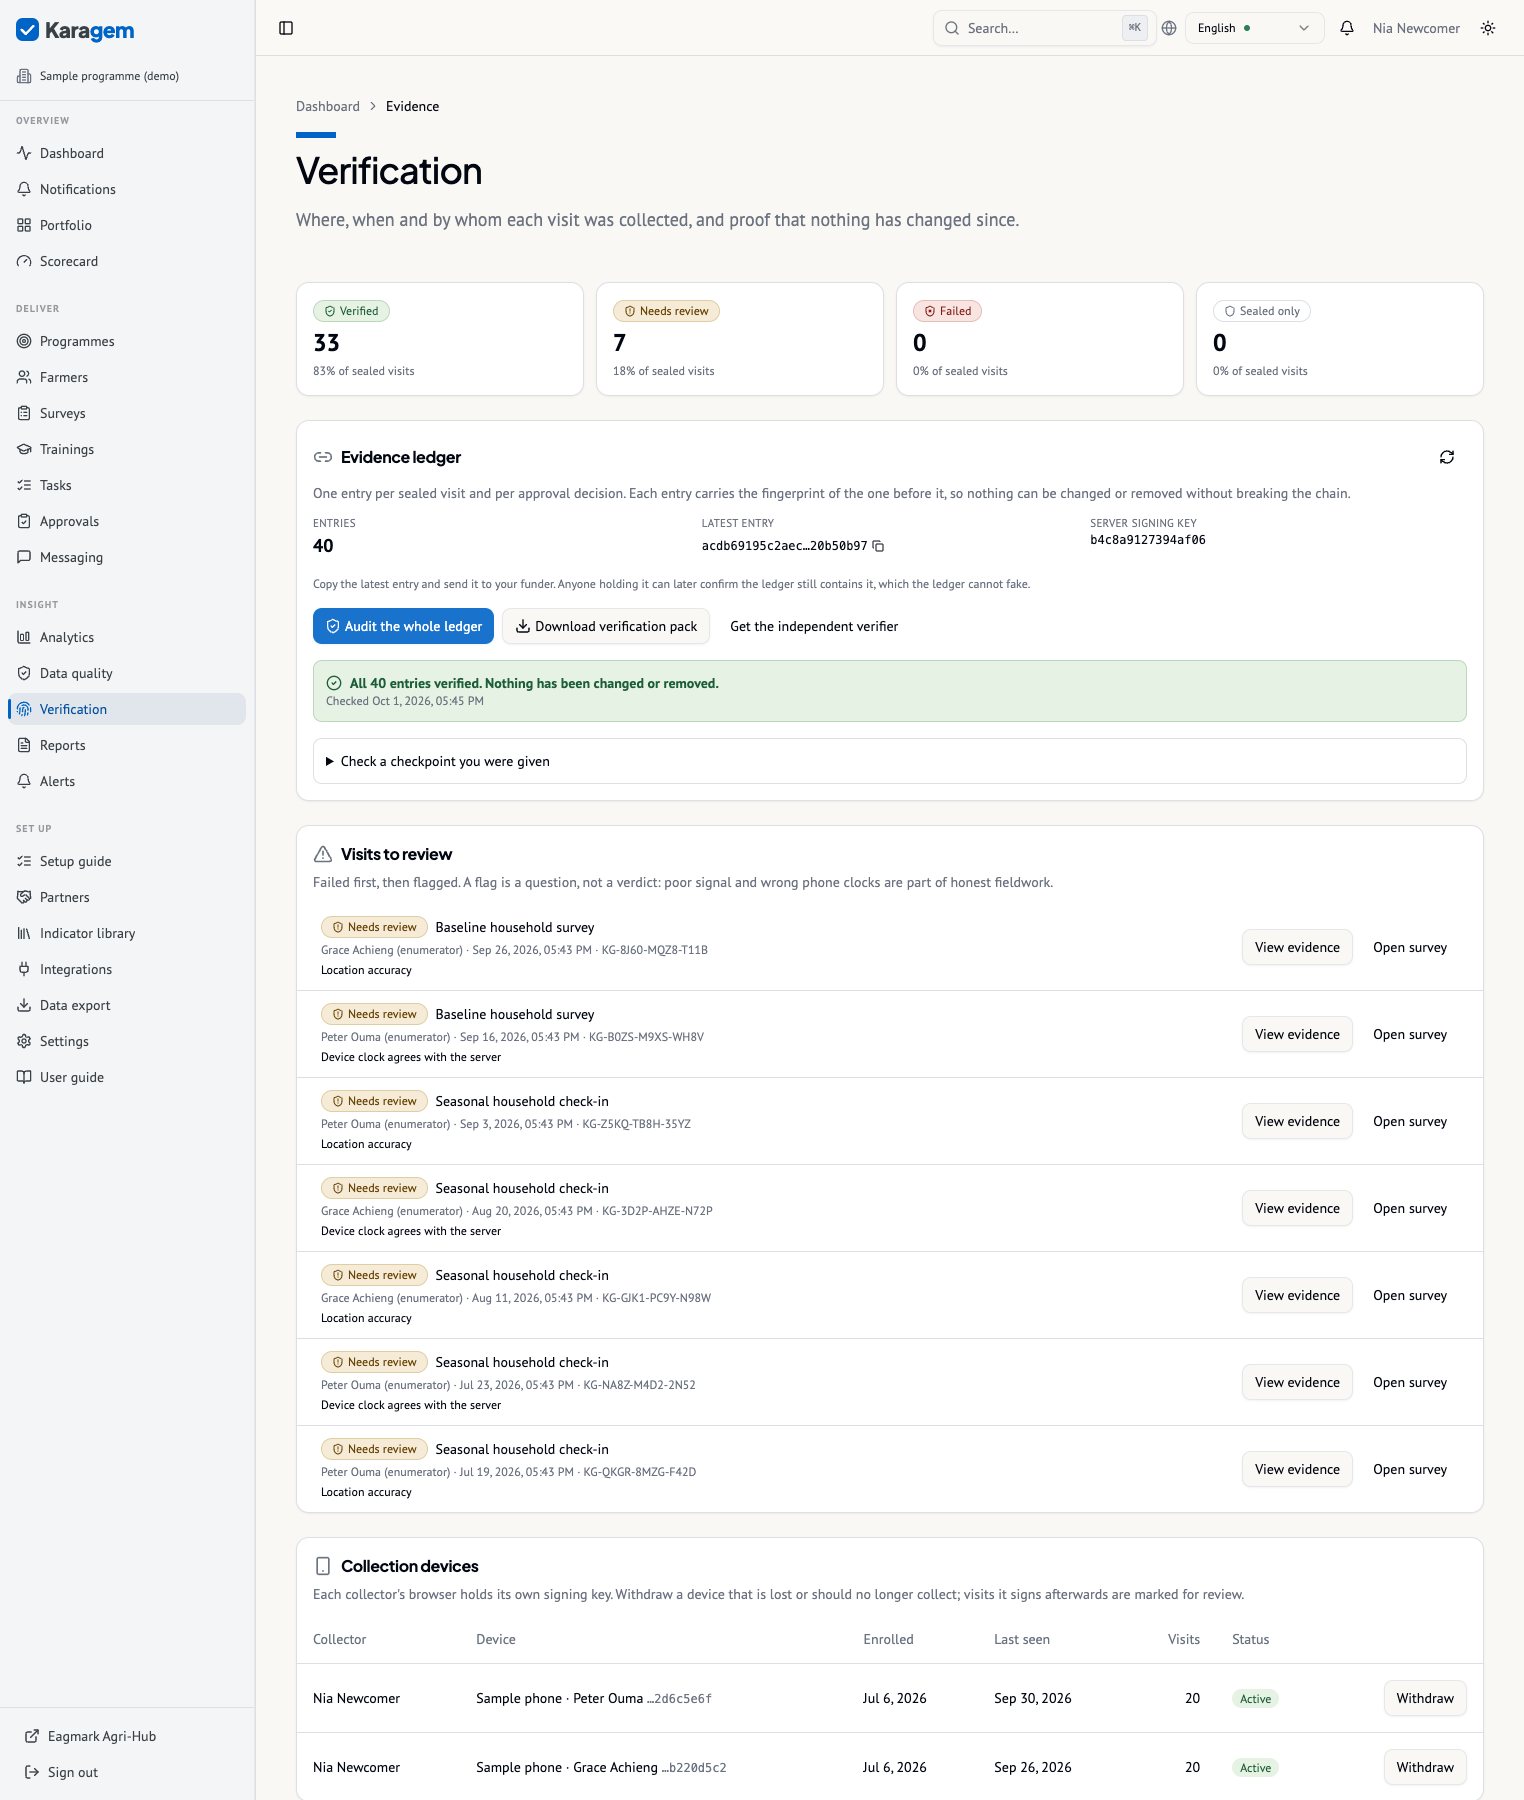
What the verdicts mean
| Verdict | Meaning |
|---|---|
| Verified | Signed on the collector’s device, unchanged since, and every check passed. |
| Needs review | Signed and unchanged, but a check raised a concern: no location, a poor fix, outside the programme boundary, a phone clock that was wrong, travel that is too fast to be real. A flag is a question, not an accusation. Poor signal and wrong clocks are part of honest fieldwork. |
| Failed | The answers or the signature did not match what the device signed. The record was altered or forged before it arrived. It is kept, never discarded, and it appears on Data quality as a high-severity issue. |
| Sealed only | In the ledger from the moment it arrived, so any later change shows, but with no device signature behind its place, time or collector. Imports from Kobo, ODK and spreadsheets, submissions through the API, and records collected before this existed. |
The checks
- Location — a fix was recorded; it is good to within your accuracy limit (100 m unless you change it); it was taken during the visit, not carried over from earlier; it falls inside the programme boundary when one has been uploaded, with a fix just over the line given the benefit of its own accuracy.
- Time — the phone’s clock agrees with the server’s; the visit arrived within your sync limit (14 days) of being captured.
- Collector — the signed collector is the account that submitted it; the device is enrolled to that collector and has not been withdrawn.
- Travel — the distance from the same collector’s previous visit could be covered in the time between them.
- Content — the answers, and any photo or signature that arrived with them, match the fingerprints the device signed.
Check a visit
- Surveys → a survey → Results. Each response shows its verdict; open one to see the Evidence panel with the place, time, collector, every check and the receipt code.
- Press Verify now. Karagem re-derives everything from what is stored at this moment and compares it with the ledger. “Unchanged since it was sealed” means exactly that.
- The same panel appears on a submission in the Approvals queue, so the reviewer sees it before deciding. The decision itself is added to the ledger beside the visit.
Audit the whole ledger
- Verification → Audit the whole ledger. Every entry is re-hashed, its link to the previous entry and the server’s signature are checked, and each visit is compared with the answers held now.
- A clean audit says how many entries were verified. A problem names the entry and what is wrong with it: an entry edited, removed or out of order, answers changed after sealing, a response deleted.
- Copy the latest entry and send it to your funder. It is a checkpoint: anyone holding it can later confirm the ledger still contains it, under “Check a checkpoint you were given”. A ledger that had been rewritten could not pass that test.
For your funder
- Receipt codes — every sealed visit has one (KG-XXXX-XXXX-XXXX). Anyone can enter it at me.eagmark.net/verify/visit and see whether the visit is in the ledger and unchanged. The page is public, so it shows no answers, names or coordinates.
- Verification pack — Download verification pack gives the whole ledger as one file: fingerprints, verdicts and signatures, no answers. “Get the independent verifier” is a short script an auditor can run on that file with nothing but Node installed. It does not contact Karagem.
- Reports and the donor link — generated reports state how many visits were verified and carry the ledger checkpoint at the time of writing; the donor link shows the same counts beside the number of responses.
Surveys a funder pays on
In a survey’s Quality settings, turn on Require a GPS fix to submit. The collect form will then refuse to submit a visit without a fix inside your accuracy limit, and tells the collector why while they are still at the door. Leave it off and every visit is accepted, with the ones lacking a fix marked for review. Either way, nothing a collector submits is ever discarded because of its evidence.
Devices
Each collector’s browser holds its own key; two officers sharing a tablet each sign as themselves. Verification lists every device with its collector, when it was enrolled and how many visits it has signed. A programme manager can withdraw a device that is lost or should no longer collect. Visits it signs after that are still saved, and marked for review.
What this proves, and what it does not. It shows that an enrolled device, signed in as a named collector, was at a place at a time, and that the record has not changed since. It cannot show that the collector spoke to the right person or wrote down what they said; that is what approvals and spot checks are for. And a phone’s location can be faked by someone determined to: the checks on accuracy, timing and travel make that harder and more visible, not impossible.
Tip. Records collected before this existed can be sealed from Verification → Seal existing records. That protects them against later change. It cannot prove where or when they were collected, and they are labelled Sealed only.
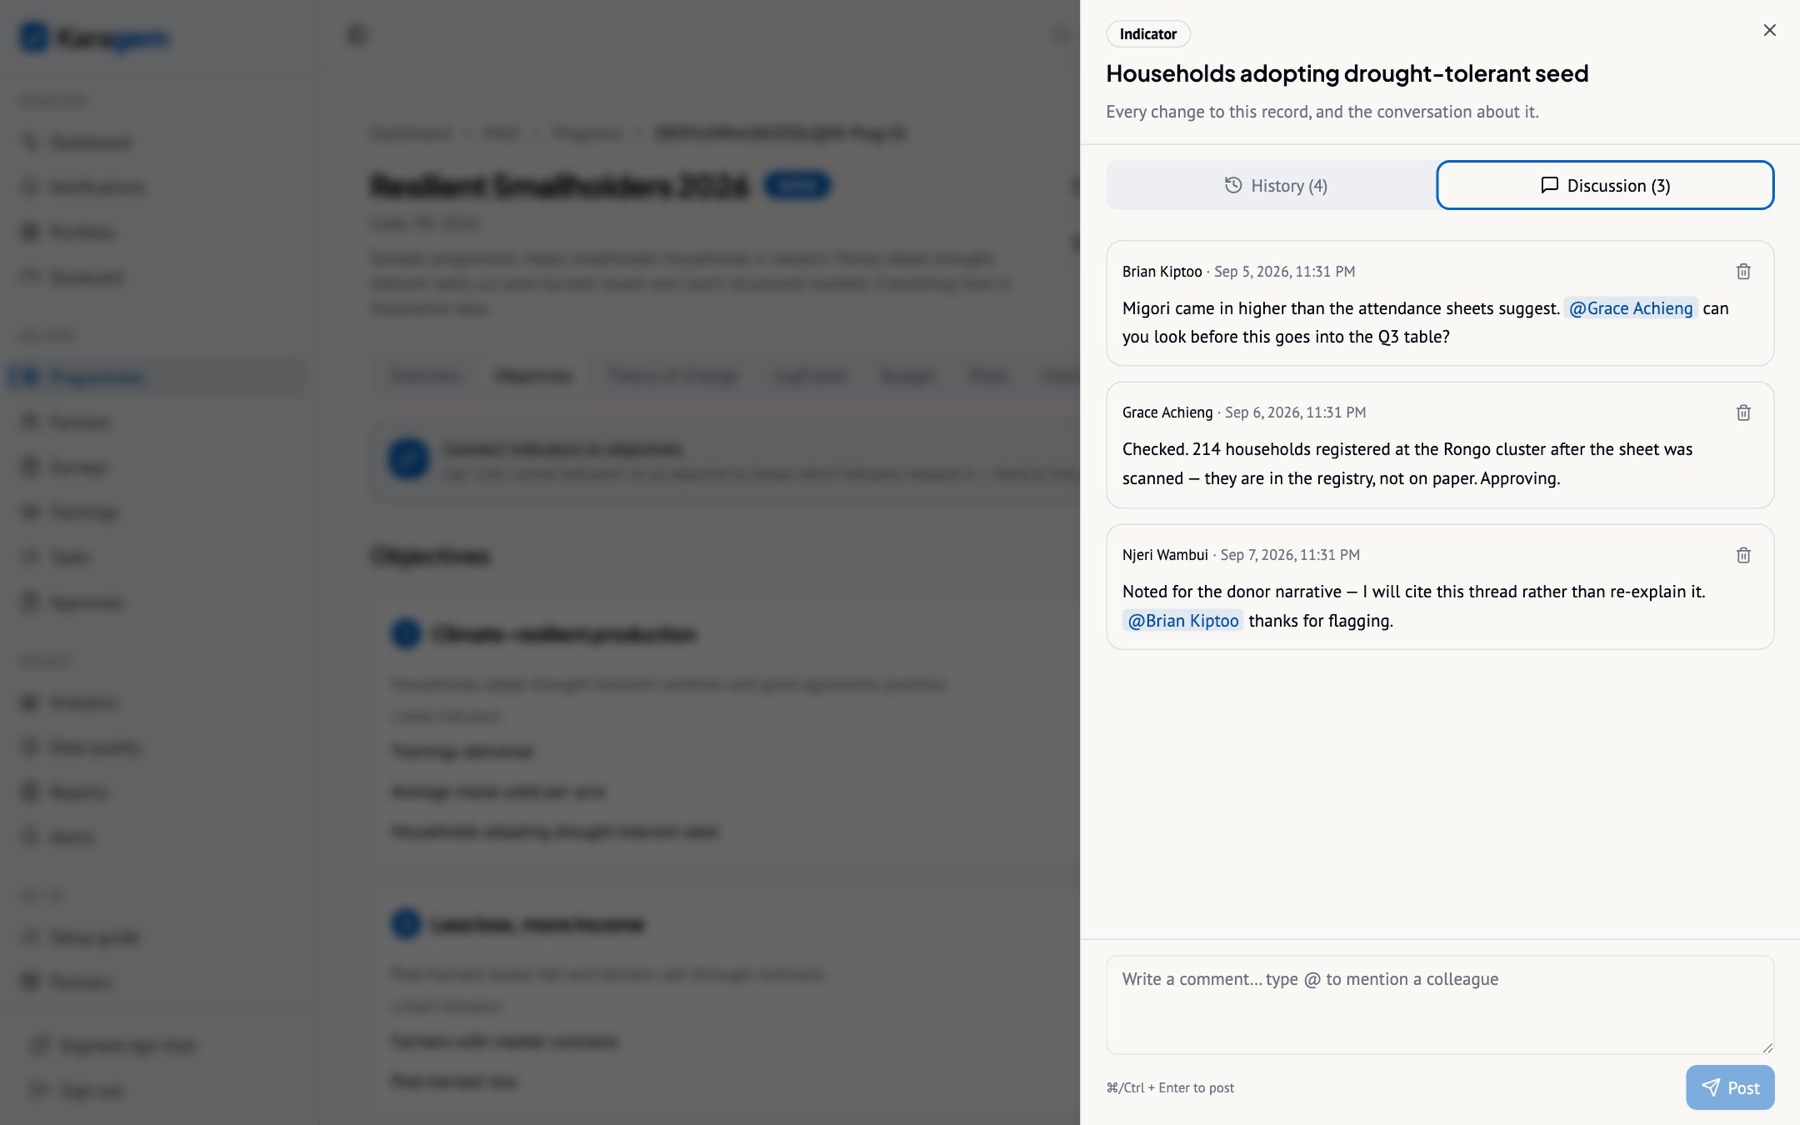
The change log
Every data point keeps its history. When an indicator’s value or definition changes, when a survey response is created or decided, when a programme’s dates or budget move, when a task is reassigned, when a portfolio figure’s weights are edited — a row is written with who, when, the field, the value before and the value after, the source (app, import, API, approval, system) and any note. It is append-only and written by the server; nobody can edit it.
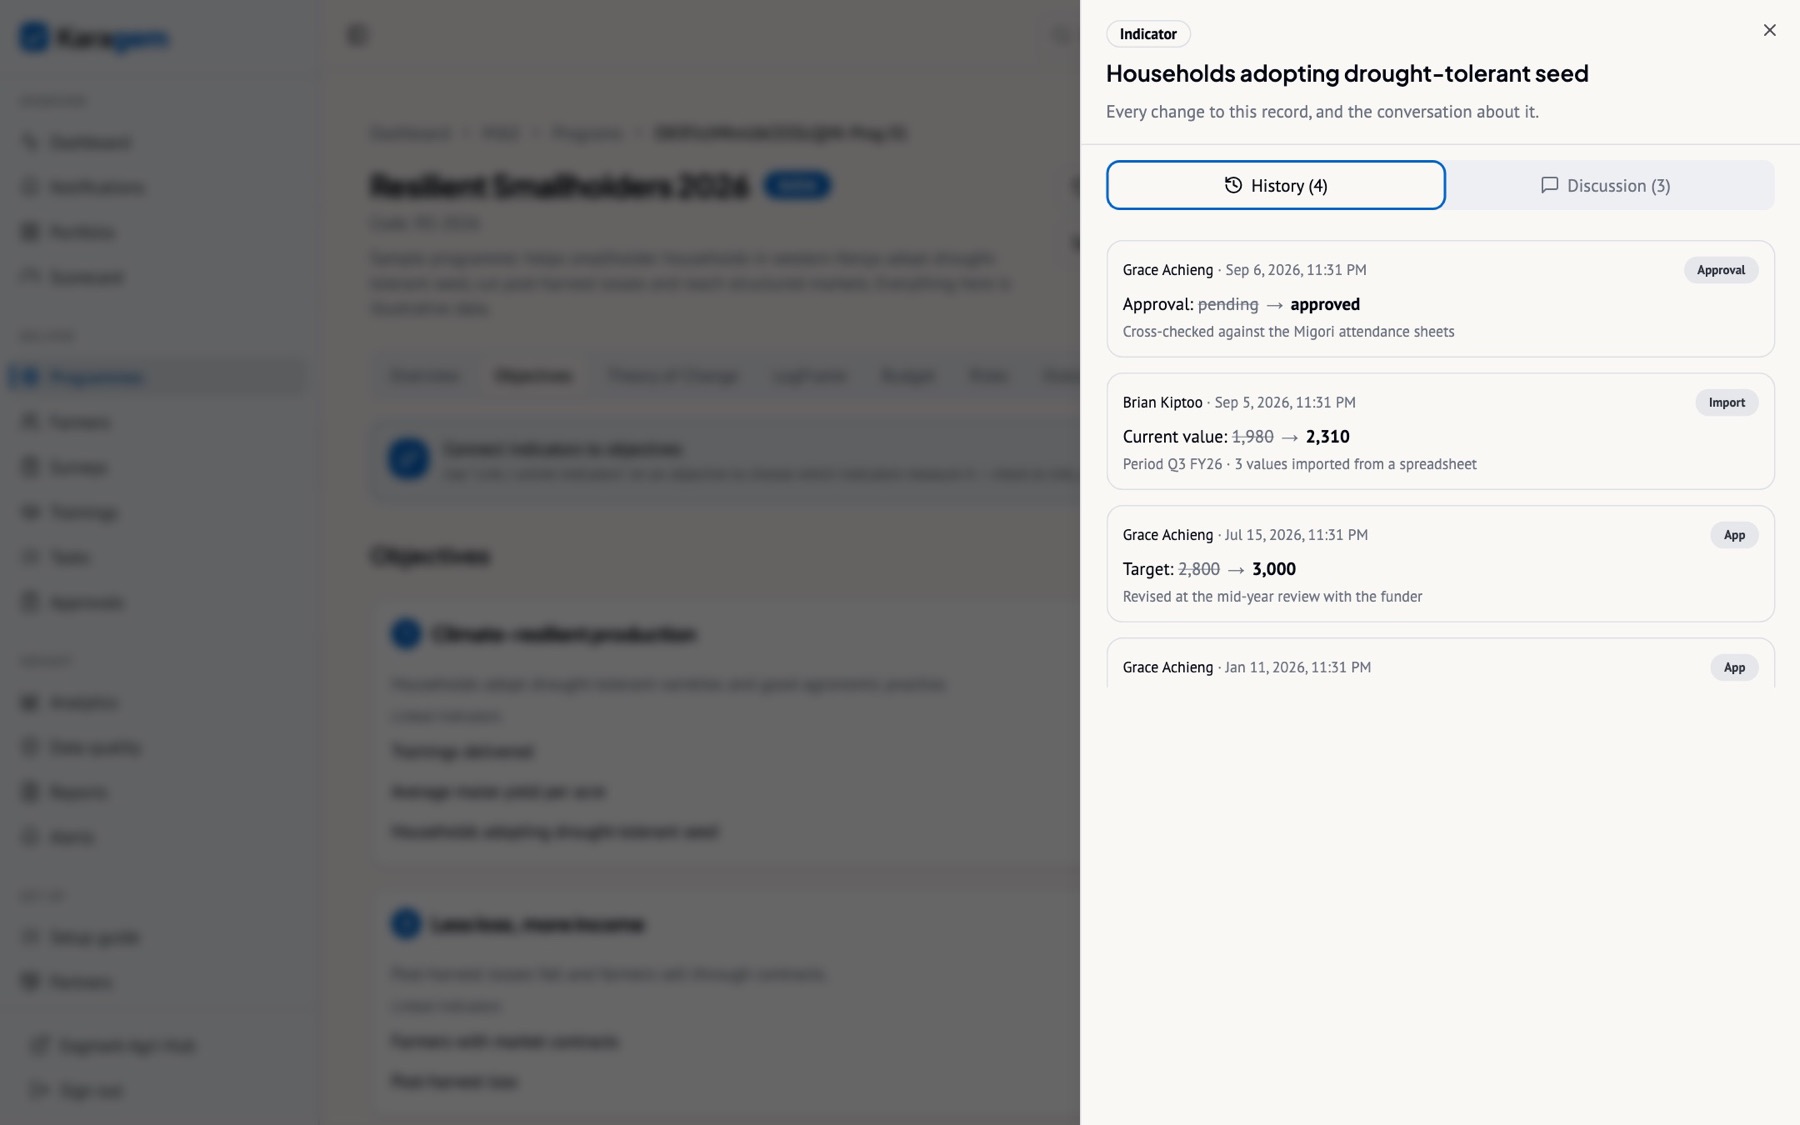
Open it from the ⋯ menu on an indicator card (Changes & discussion), the Discuss button on an approval, the speech-bubble icon on a survey response, Activity on a programme, or History on a task.
Discussions and @mentions
The same drawer has a Discussion tab. Comments stay with the record. Type @ to mention a colleague; they receive a notification in the bell with a link that opens exactly this thread. Comments are searchable evidence when a funder asks why a number changed.
Chapter VII
Steer
Find out in July about December: forecasts, alerts, tasks on a timeline, and a dashboard that puts the problems first.
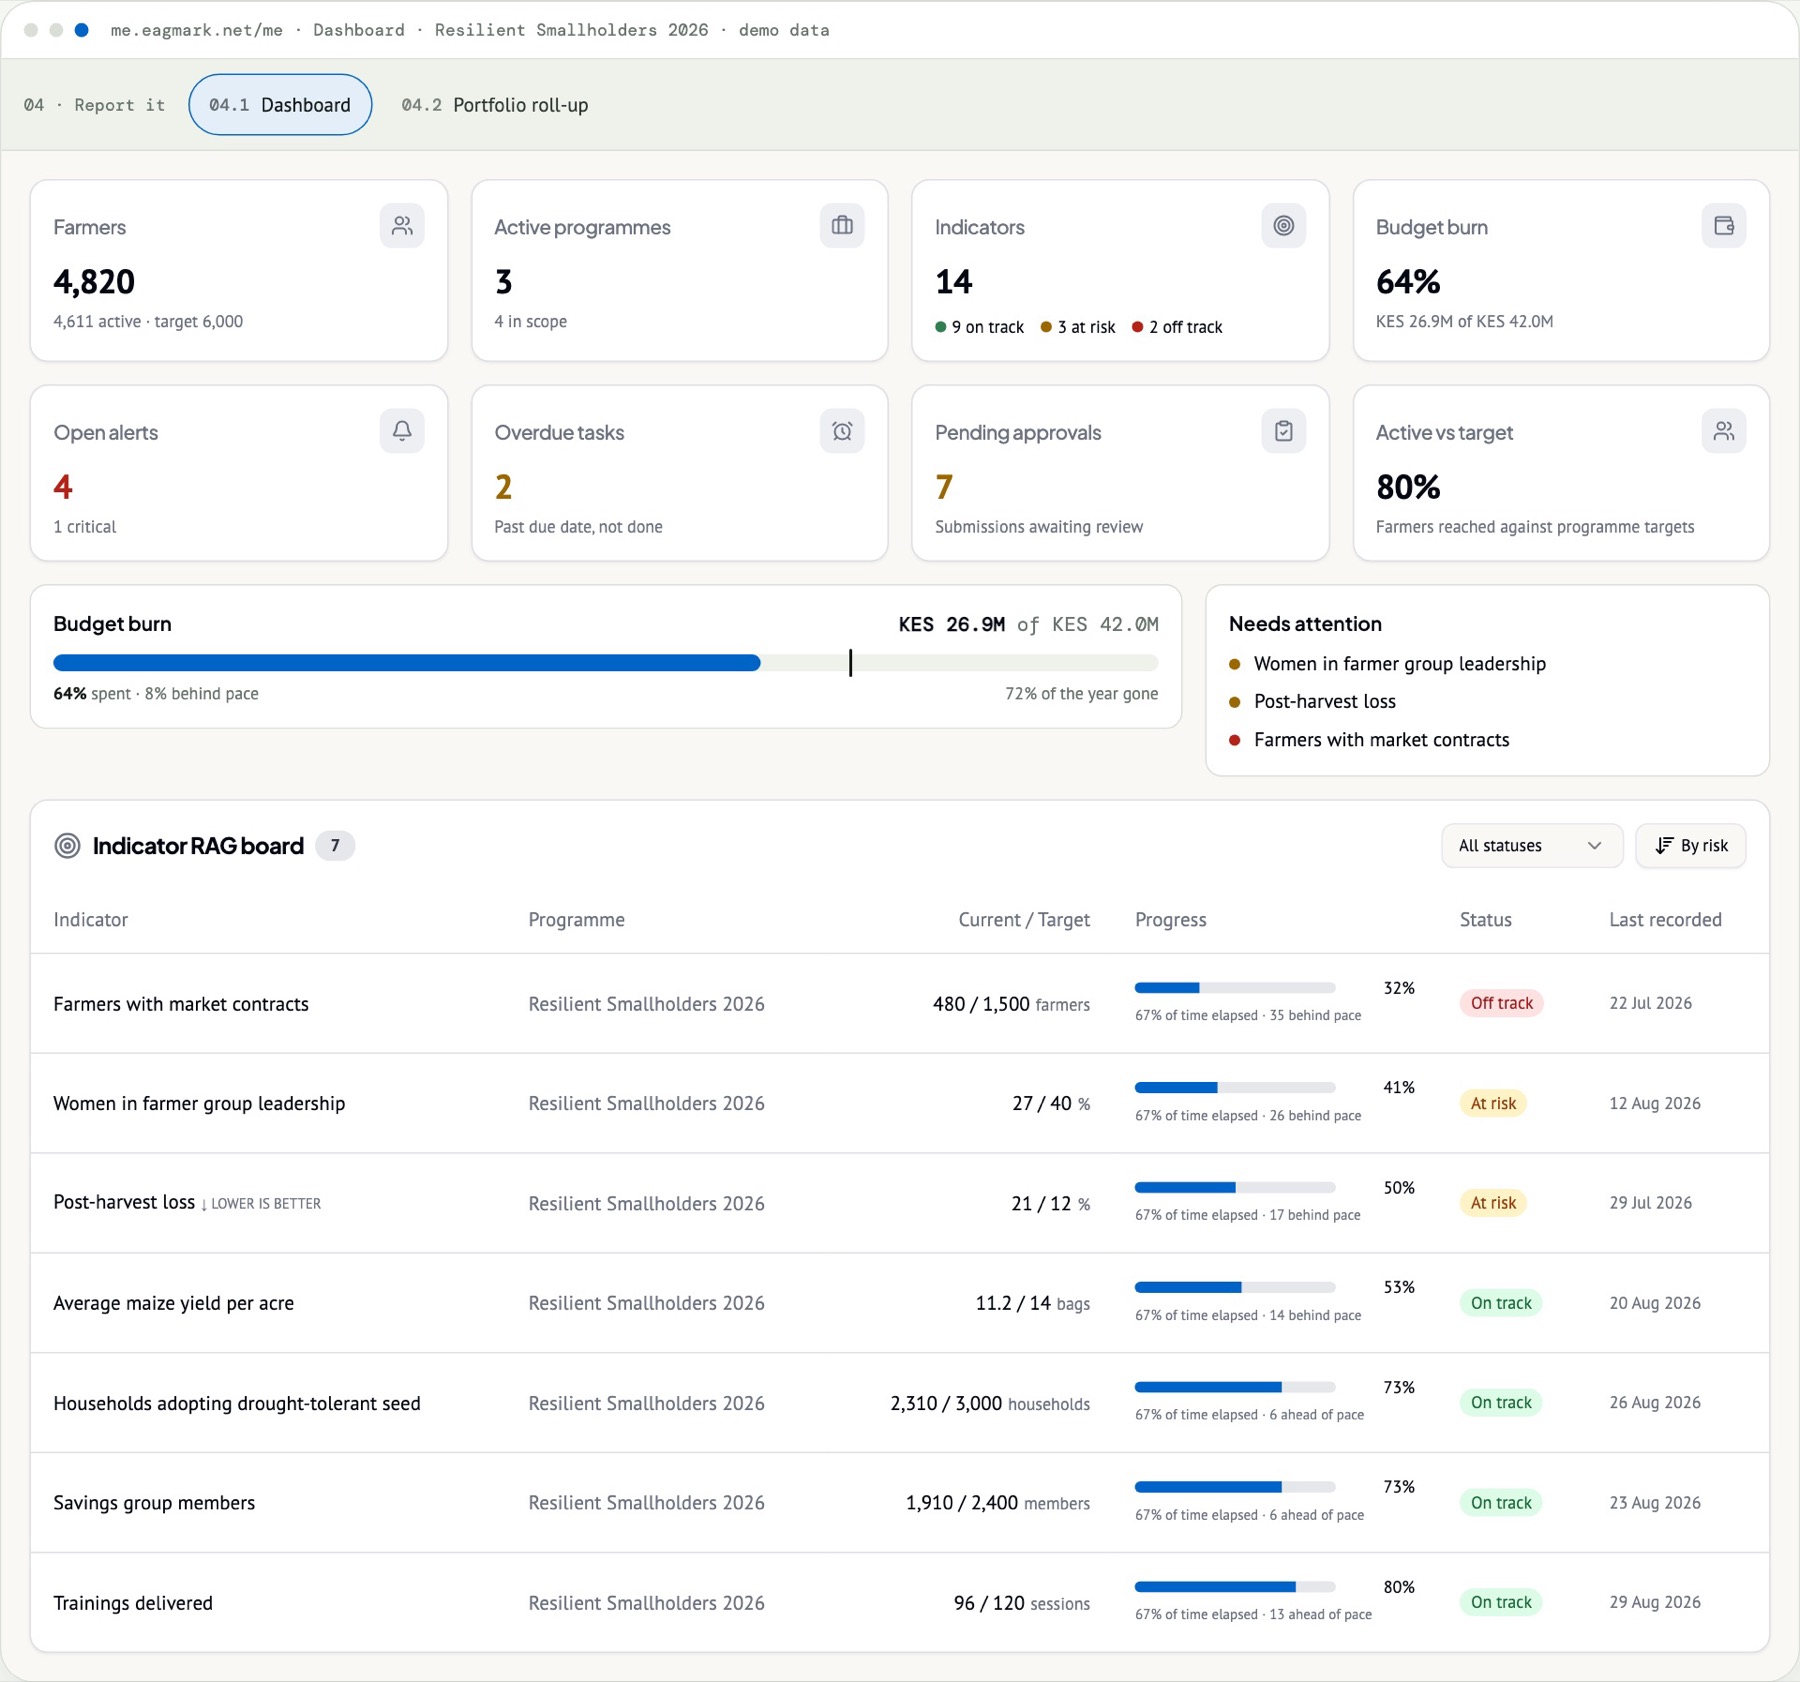
The dashboard
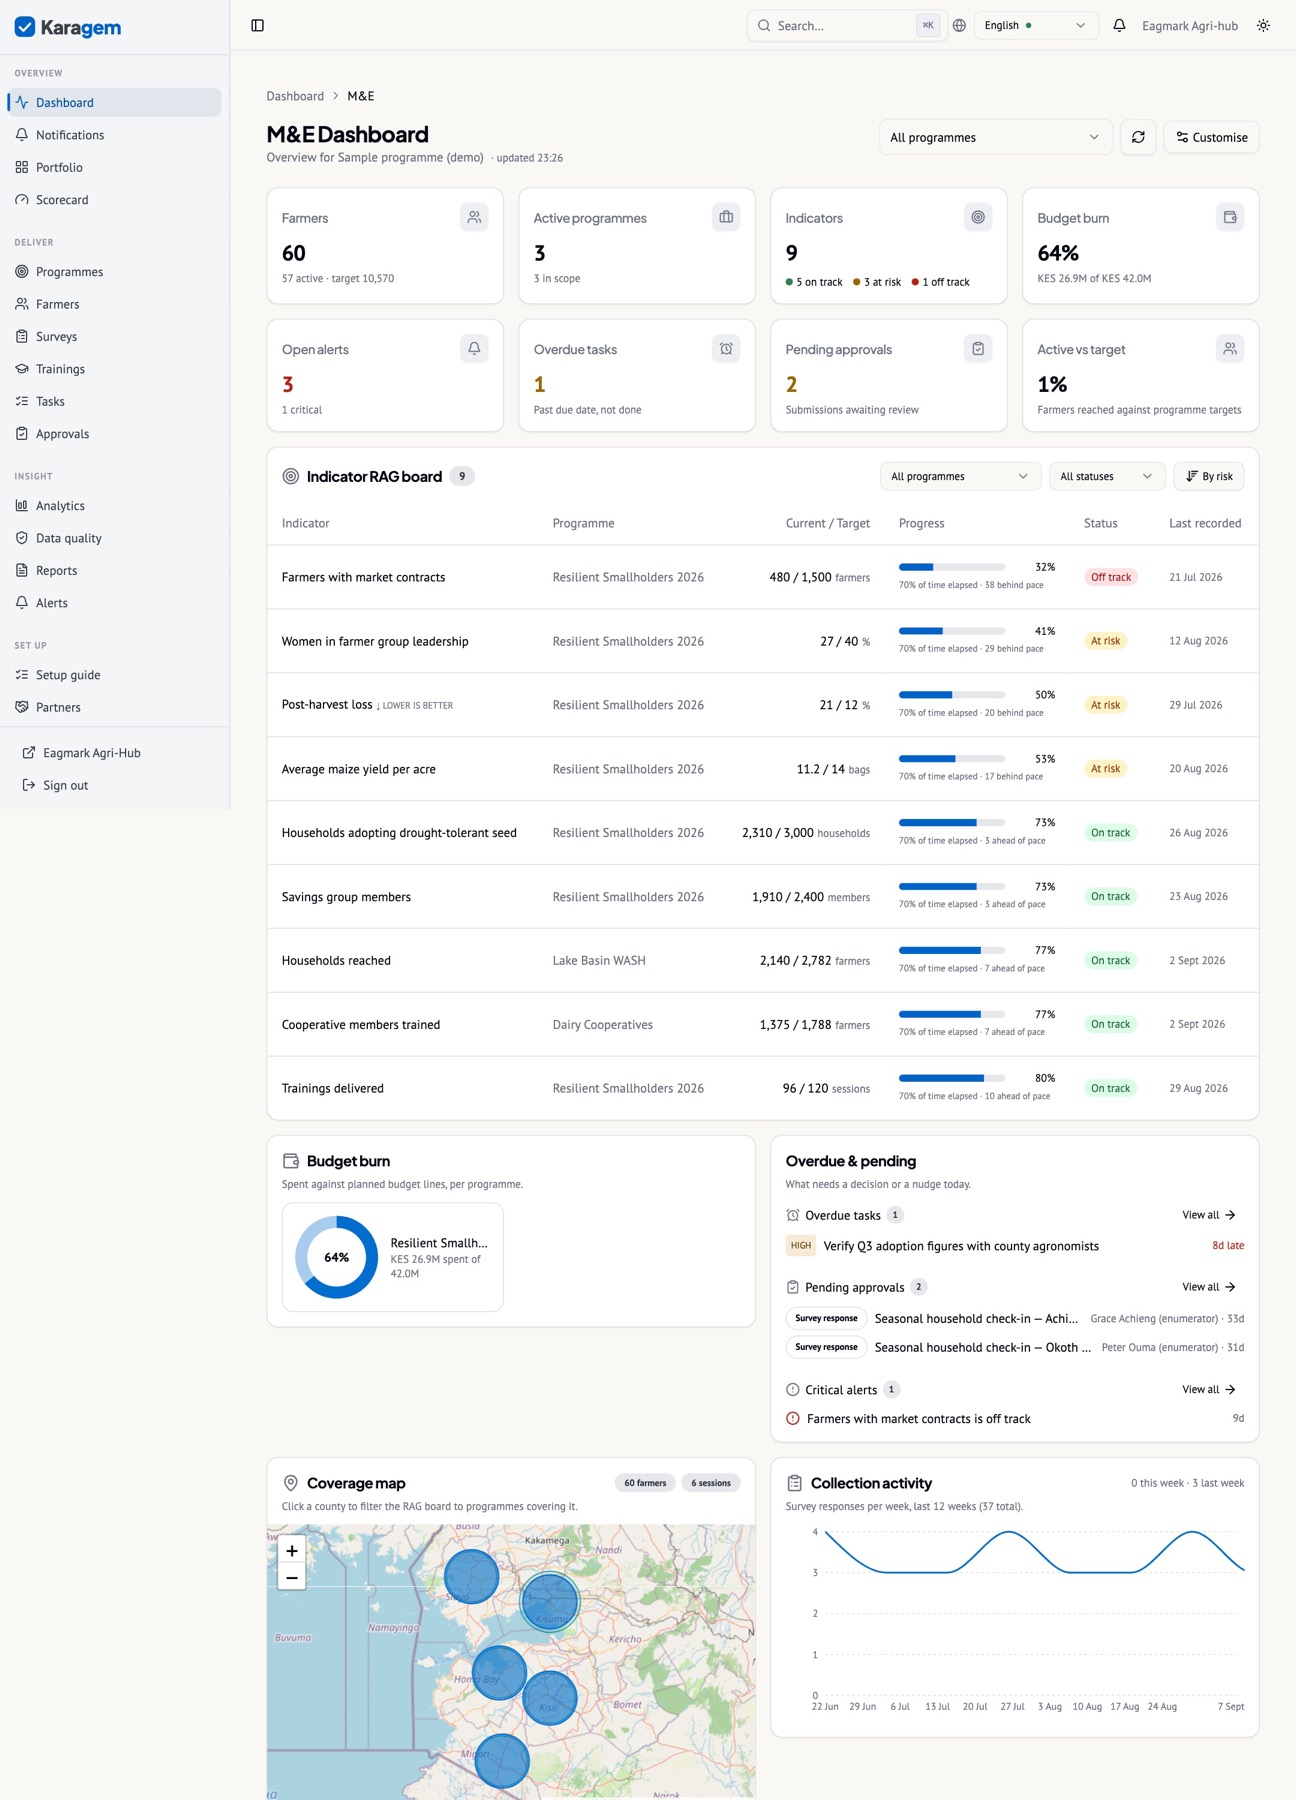
The dashboard is role-aware and customisable: KPI tiles, a RAG board of indicators with a pace verdict (“67% of time elapsed · 35 behind pace”), budget burn against time, coverage on a map, the week’s activity, overdue tasks, pending approvals and open alerts. Pin a programme to focus everything on it; hide the widgets you do not use.
Early warning
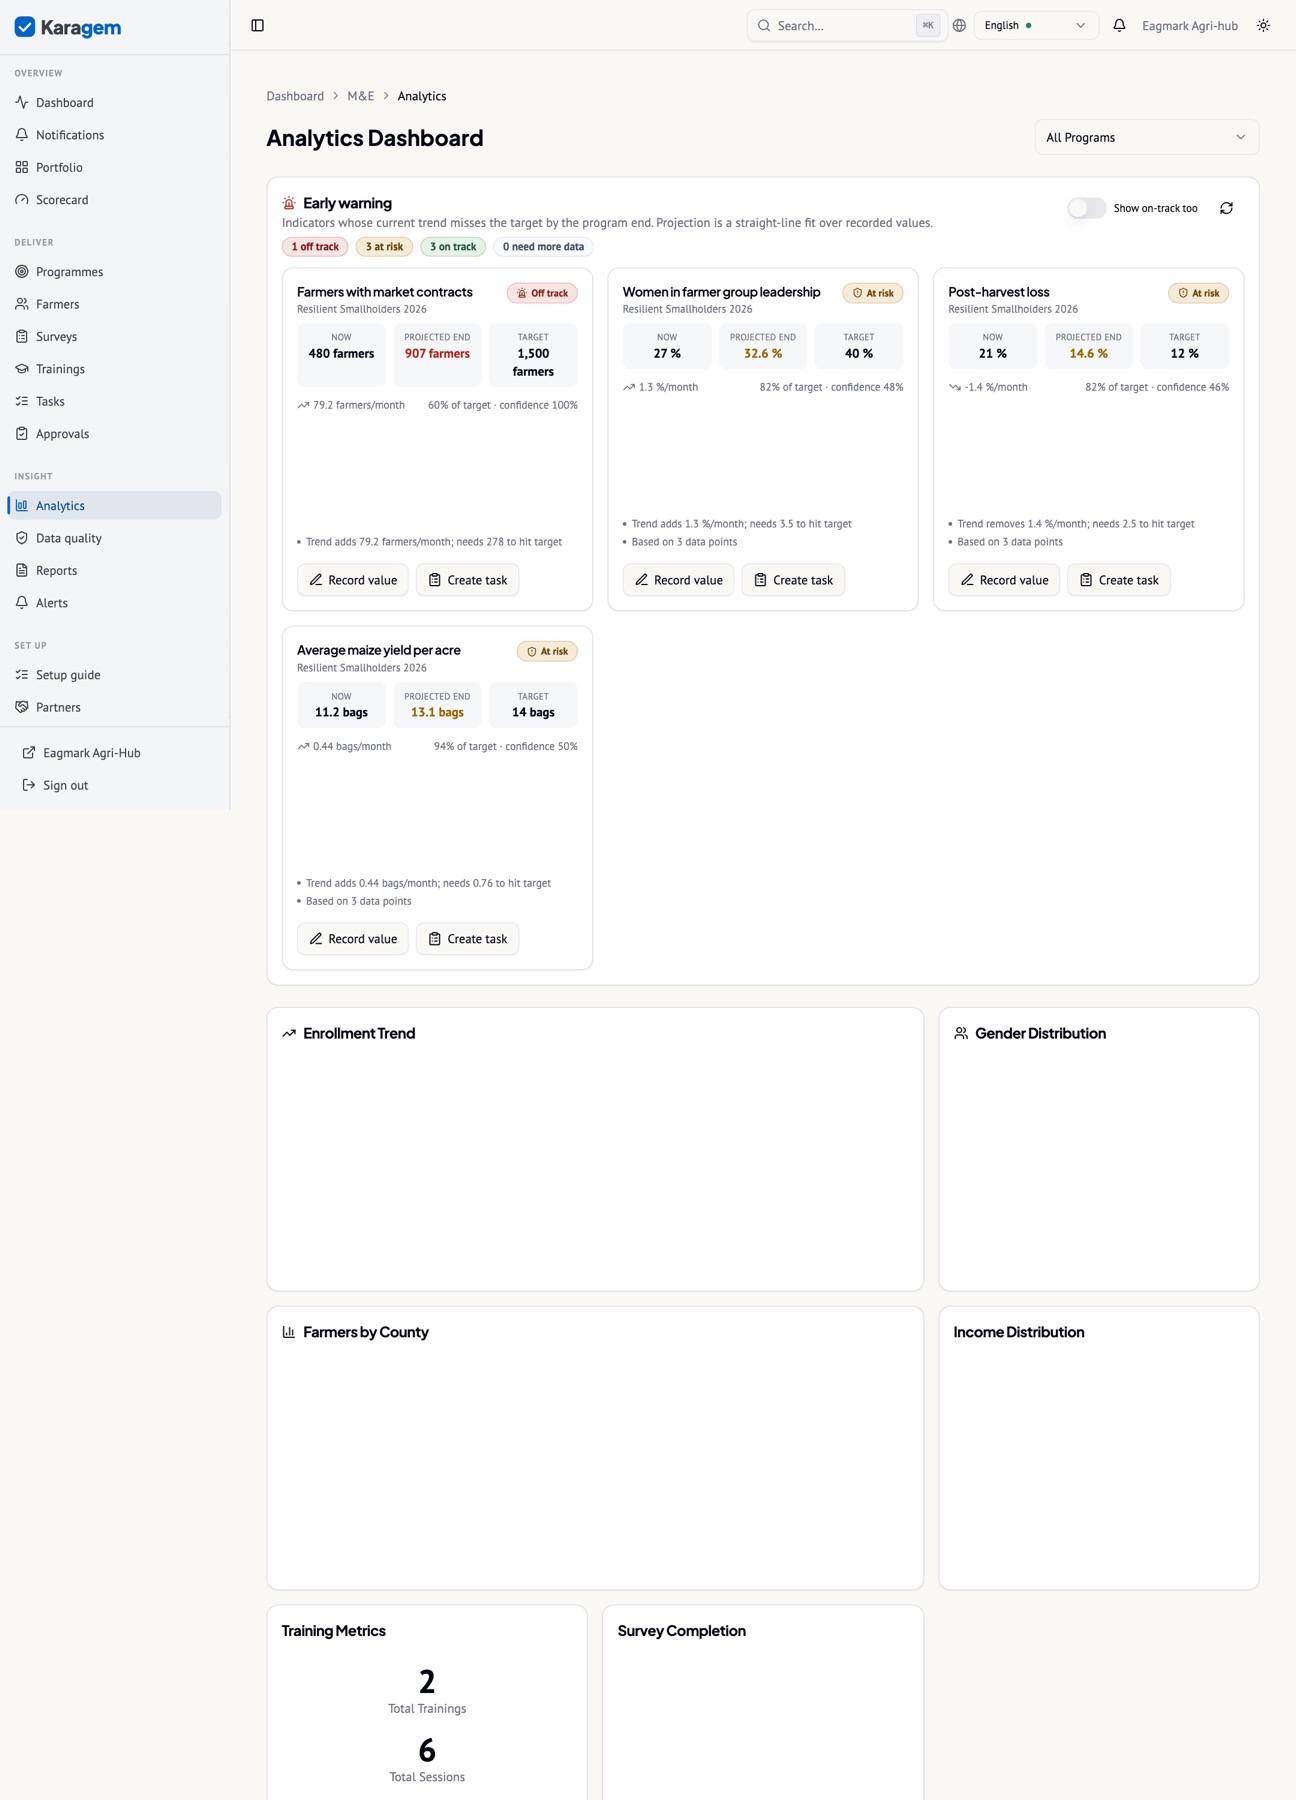
An indicator that will miss in December is a problem you can still fix in July. The forecast fits the recorded values, projects to the end date, compares with the target and says in words what is driving the risk — a flat month, a widening gap, a value not recorded for too long. From the watch list you can create a task or record a value in one click.
Alerts
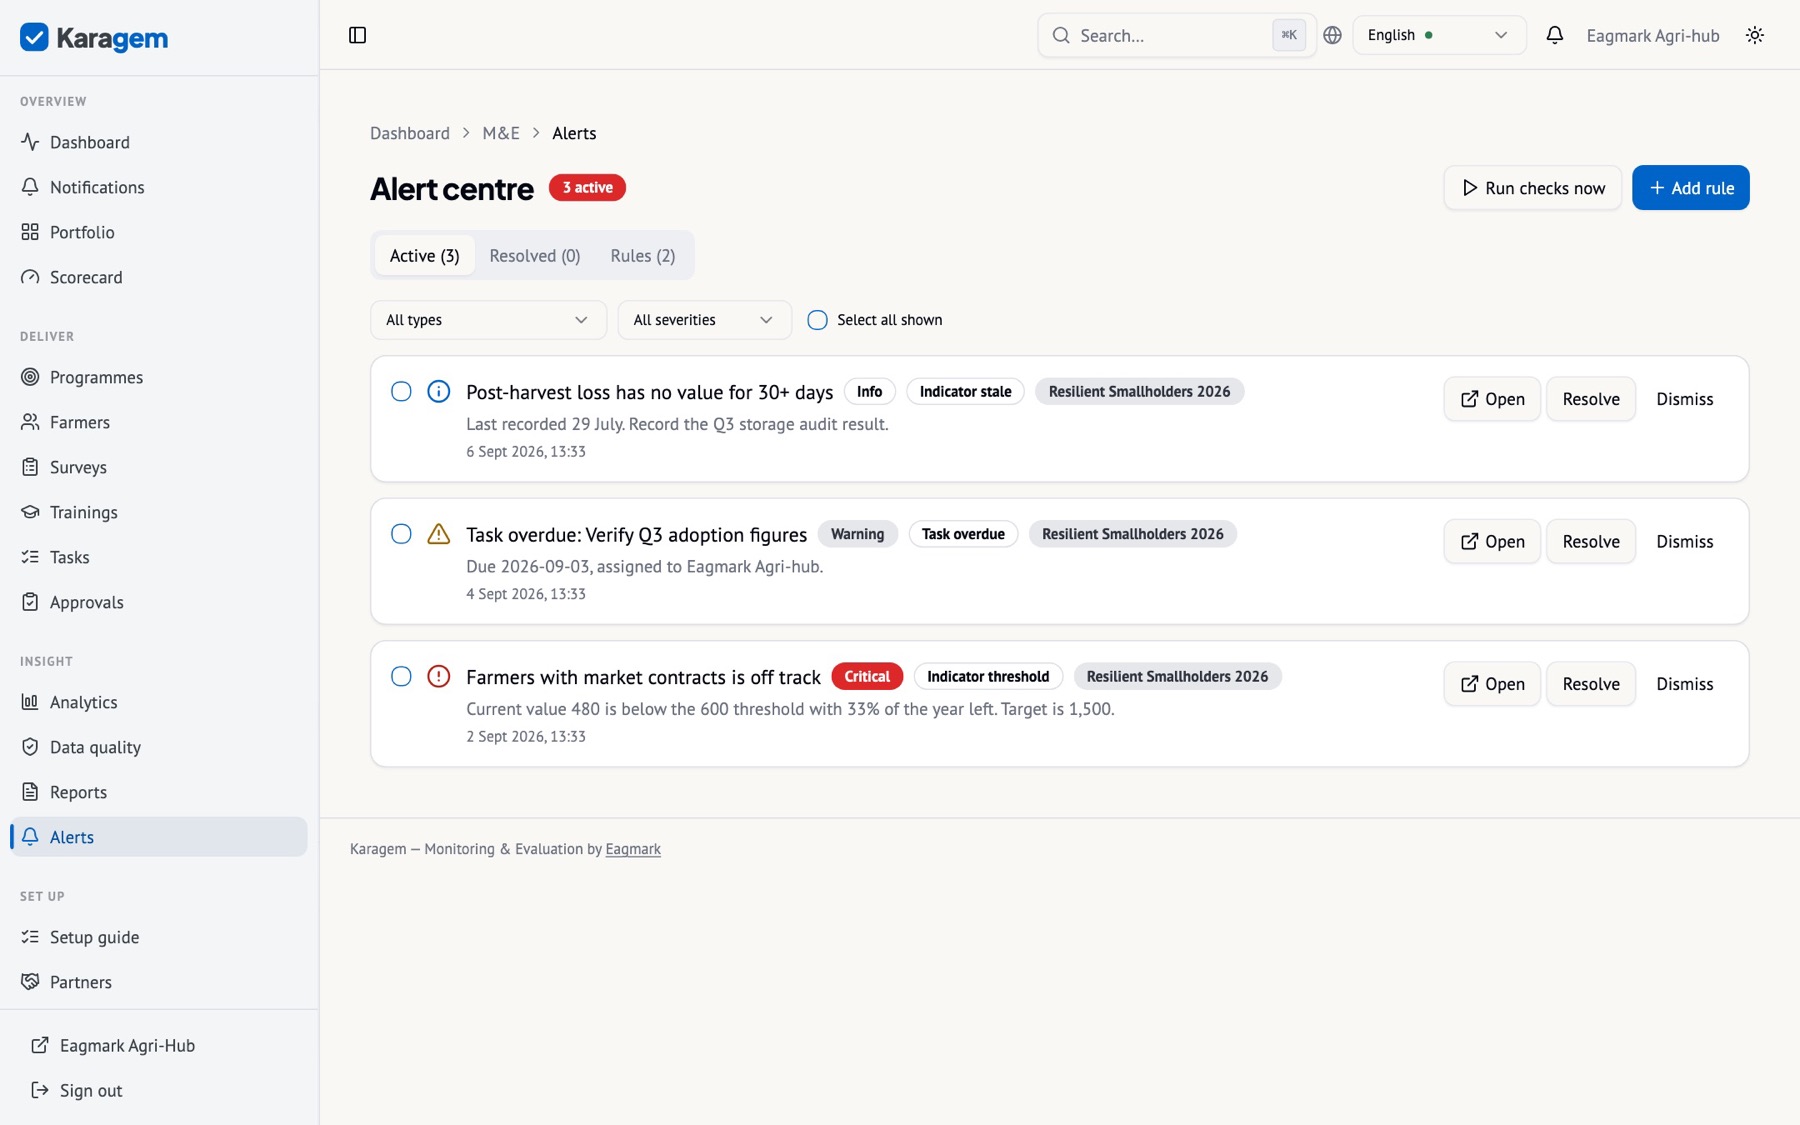
Ten rule types — an indicator below pace, a value outside a range, a stale indicator, a survey with no responses for N days, an overdue task, an approval waiting too long, a quality score dropping, a budget burning ahead of time, a beneficiary target at risk, a custom threshold — checked on a schedule and routed to the people and channels the rule names.
Tasks and the timeline
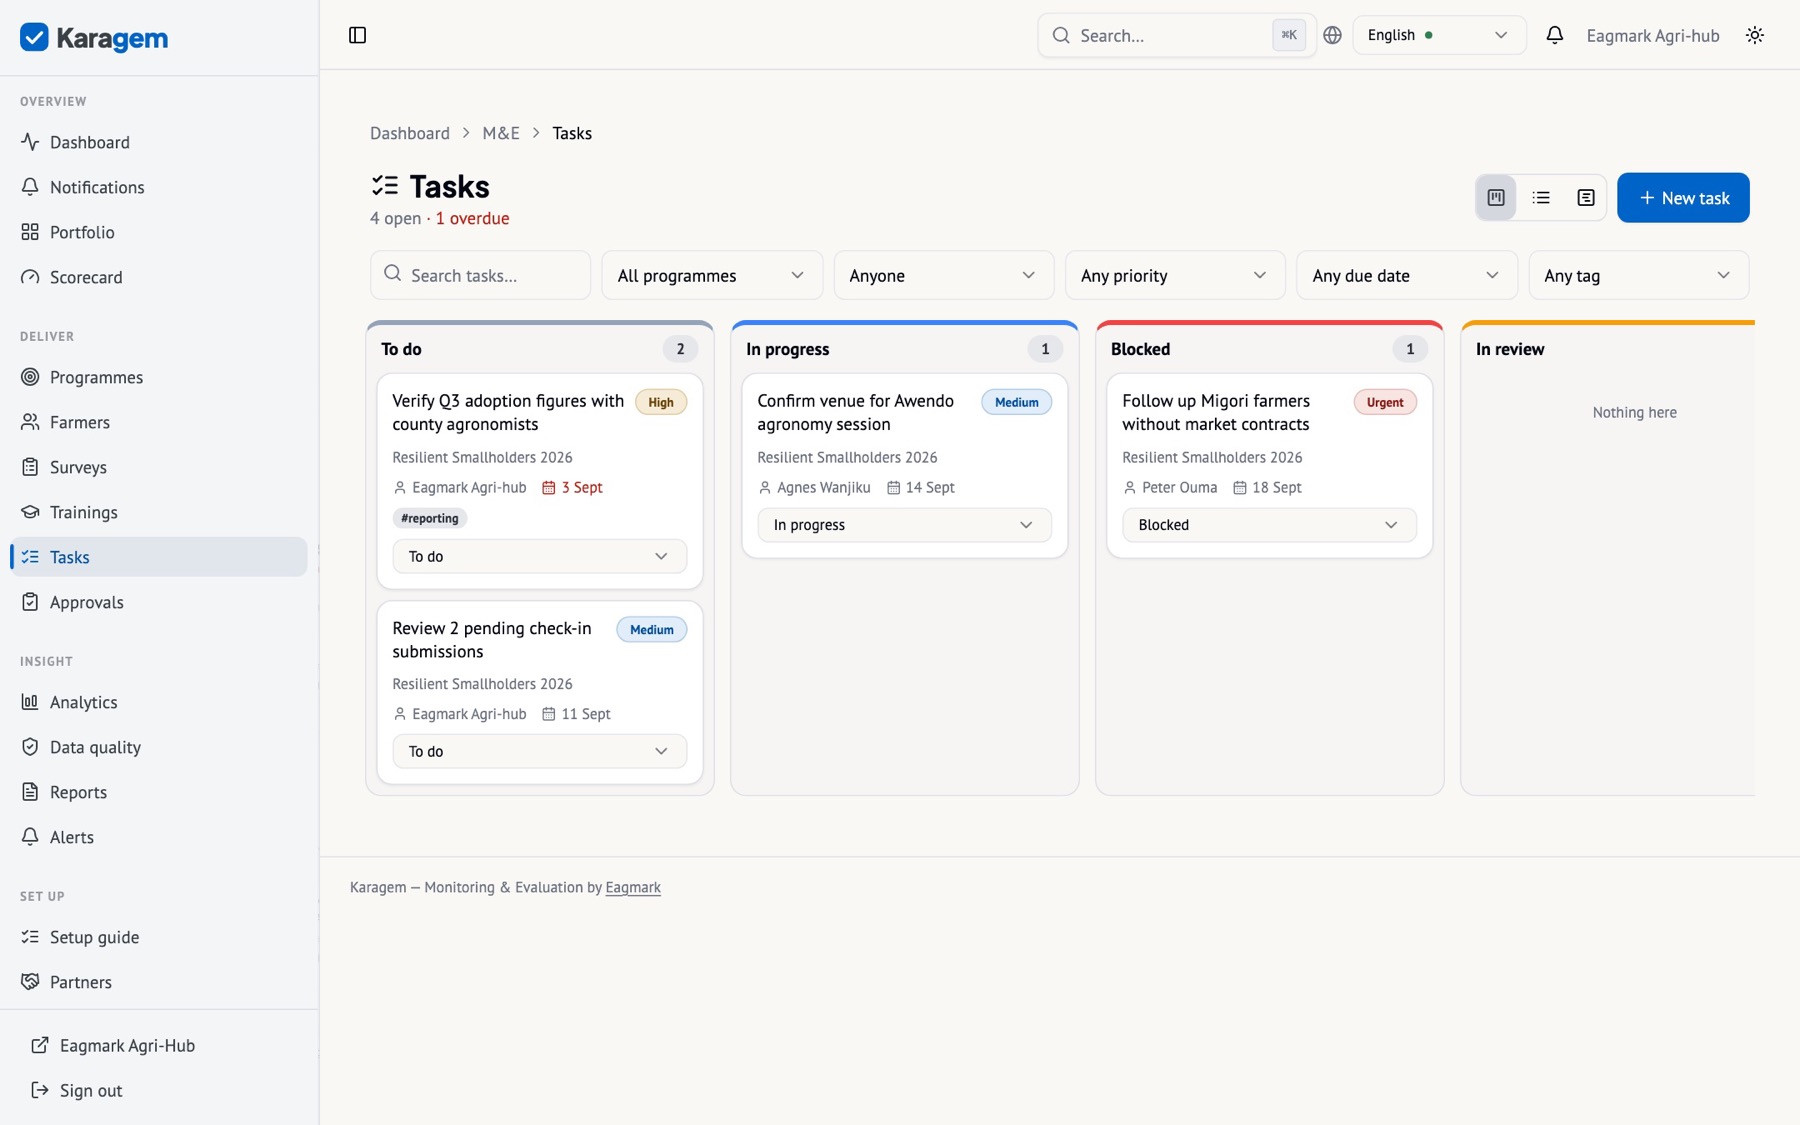
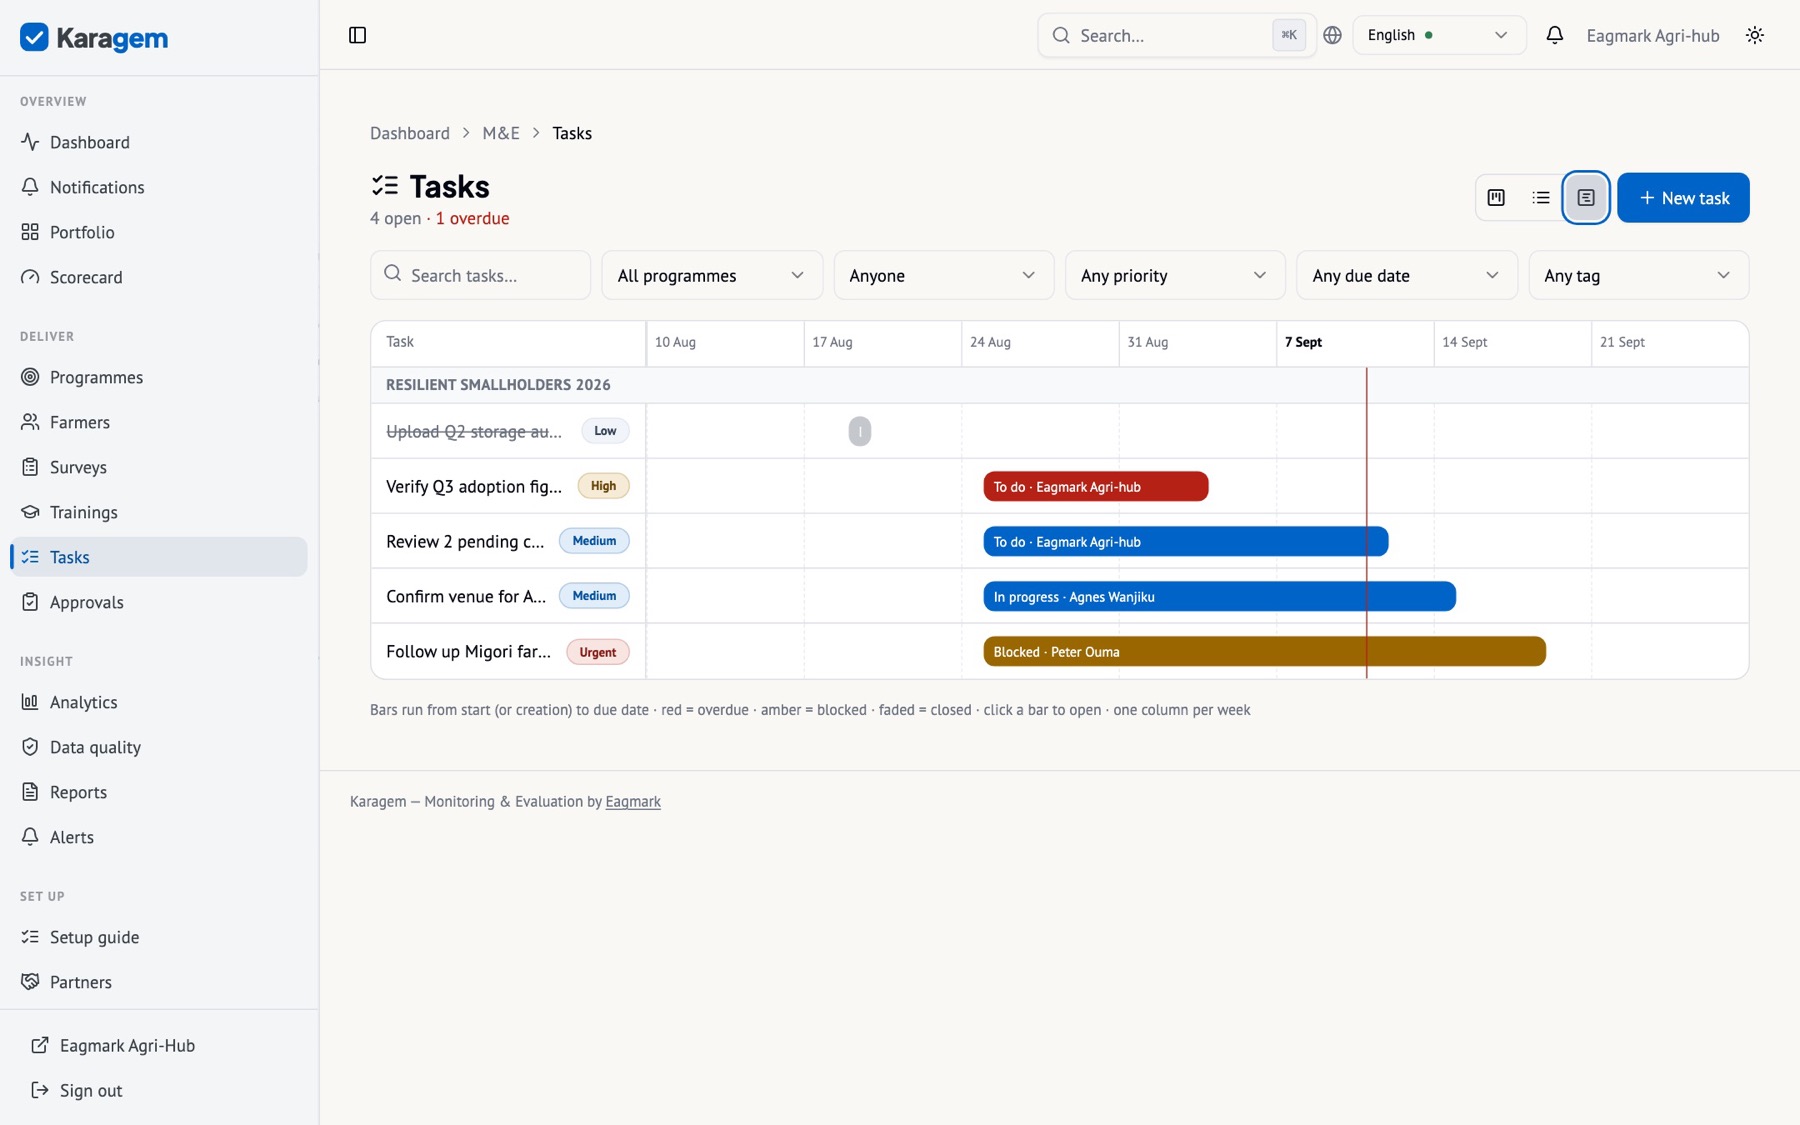
Field officers can create tasks for themselves and update the ones assigned to them; officers and managers assign. A task can be linked to the survey, training, indicator or beneficiary it is about.
Scorecard, notifications and search
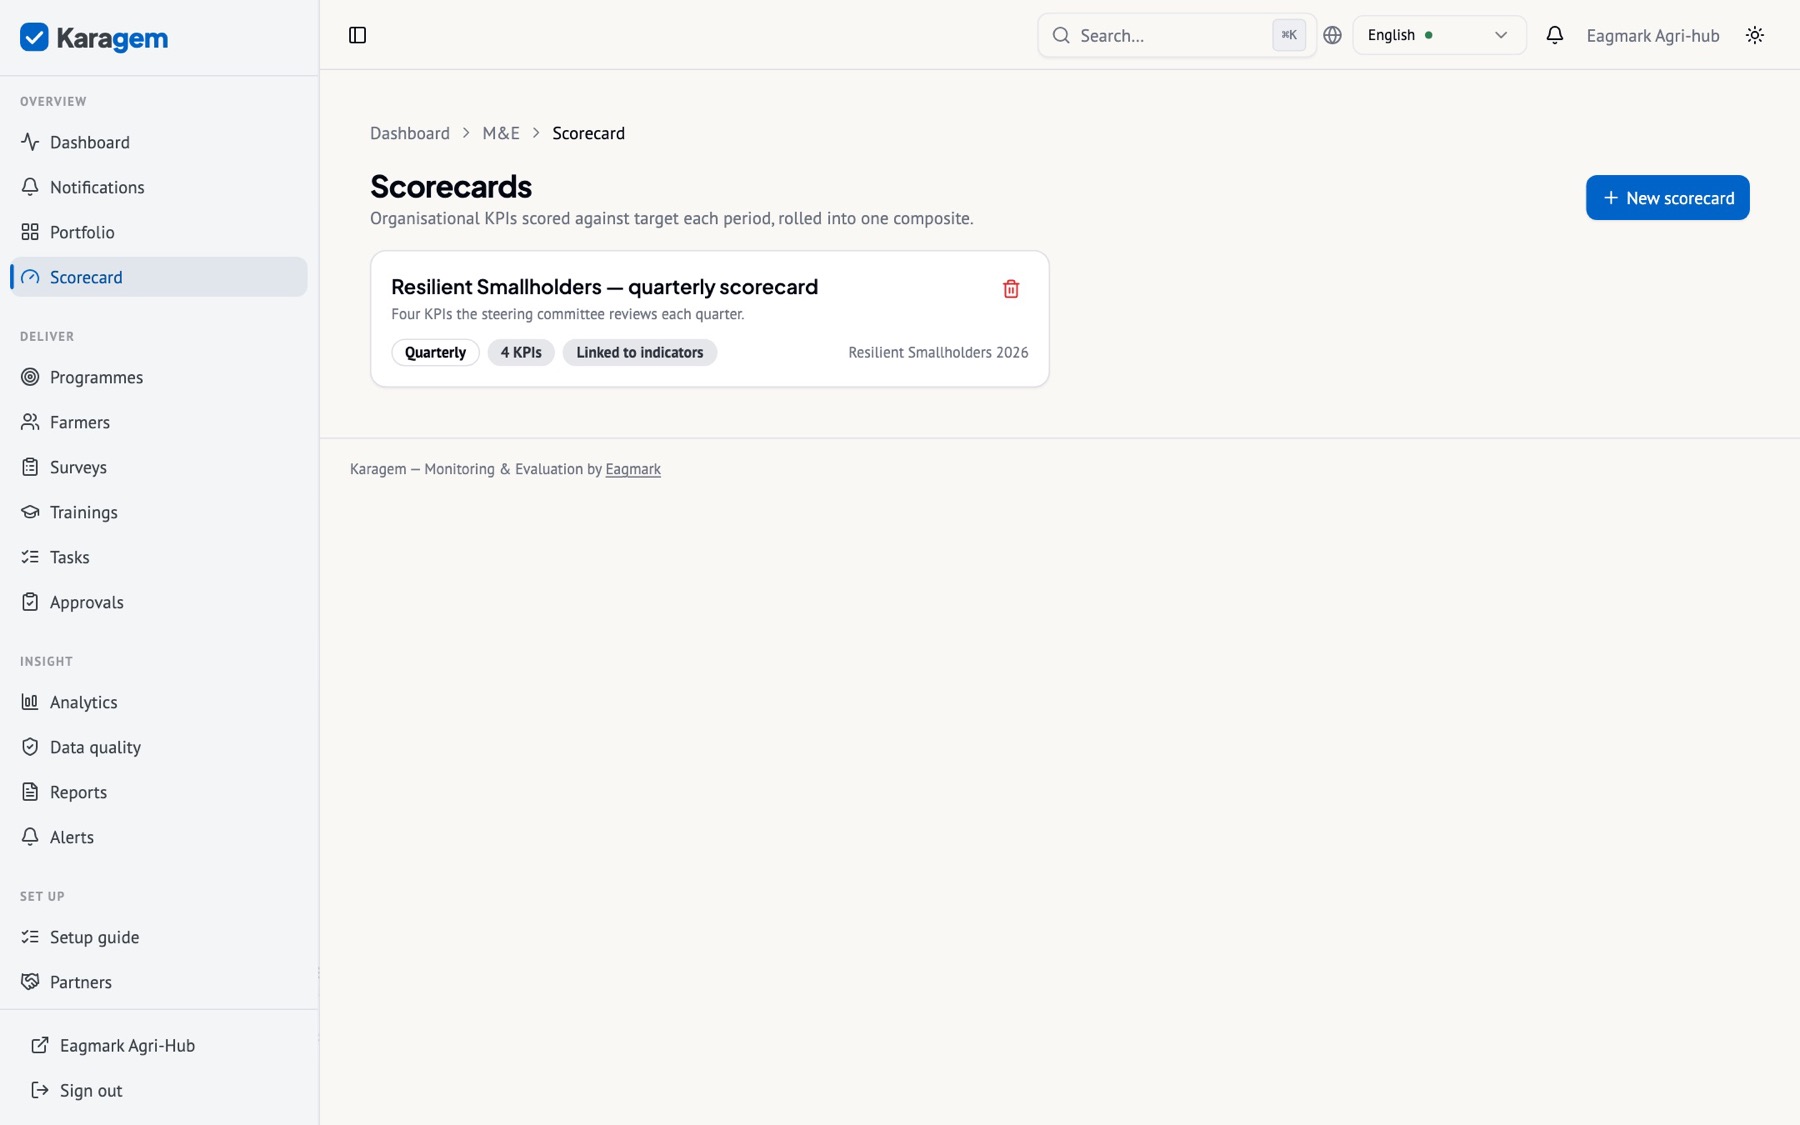
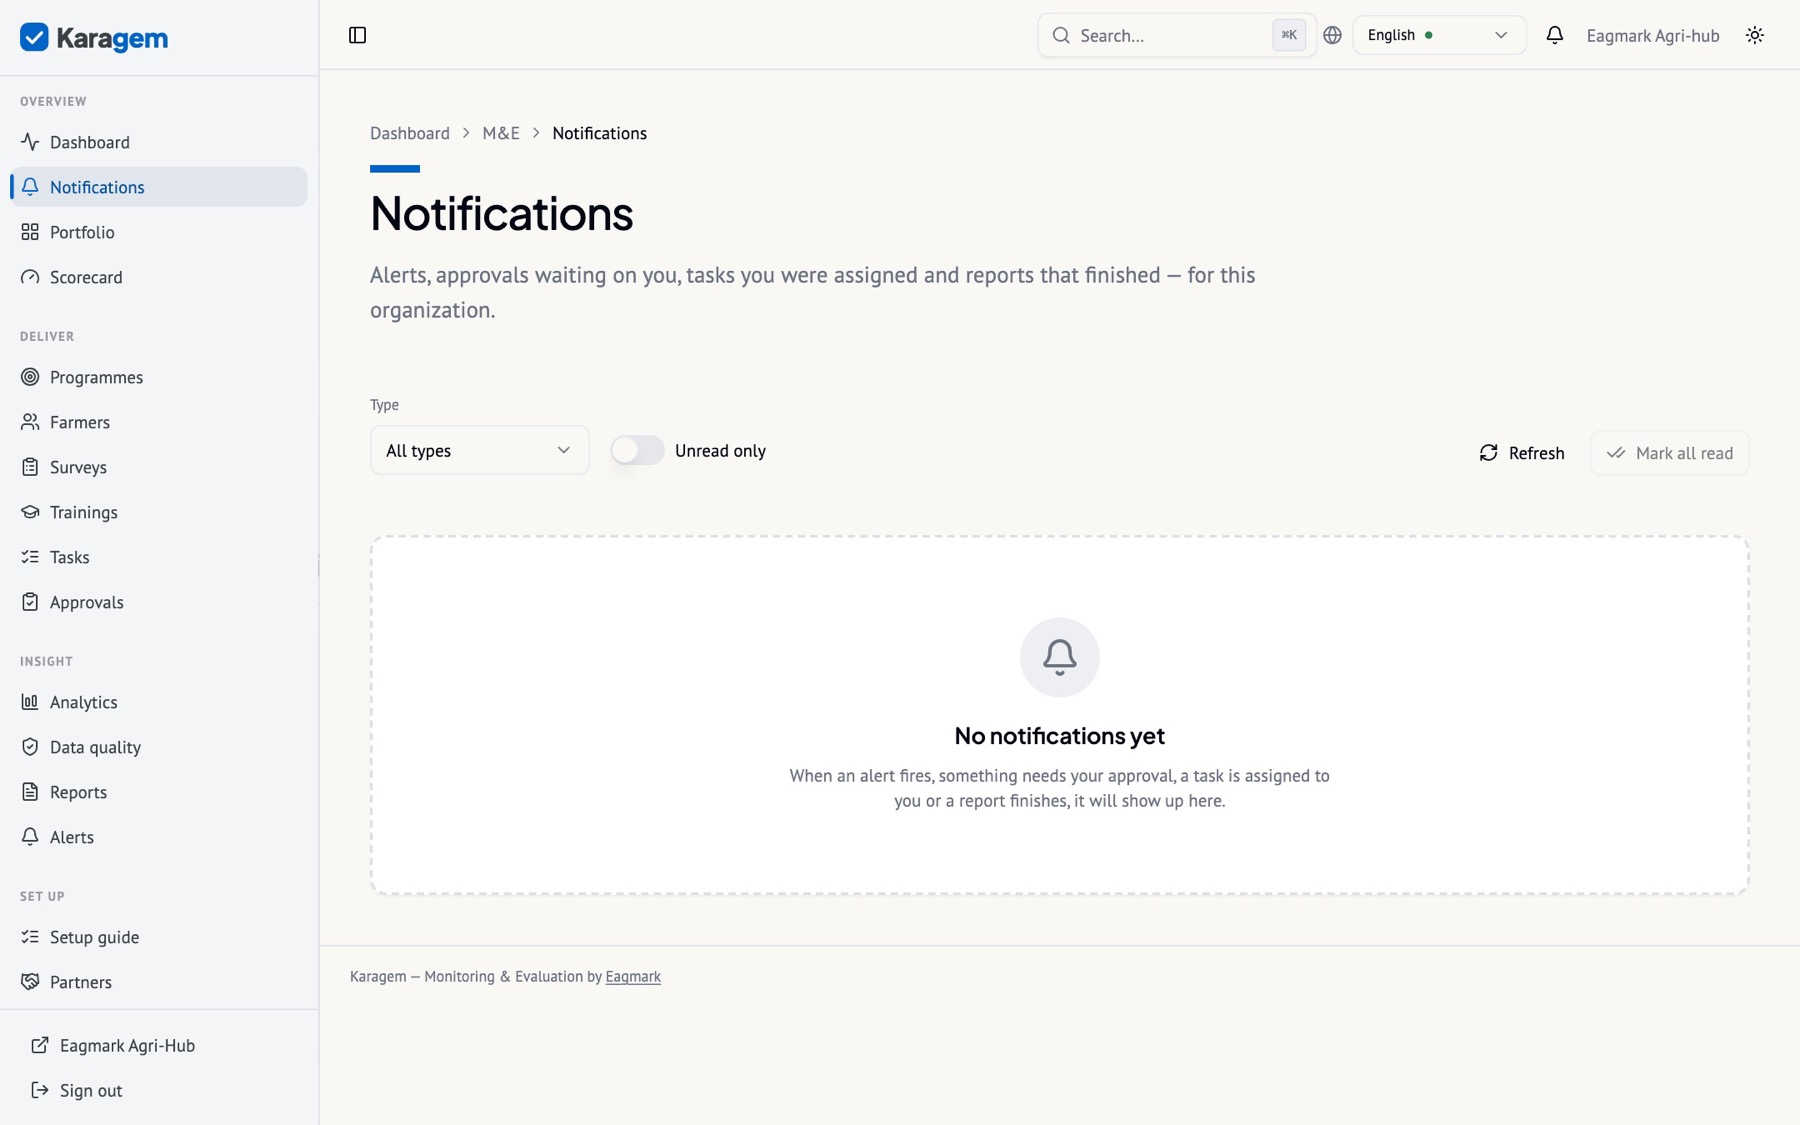
Tip. Press ⌘K (Ctrl+K) anywhere in the workspace to search programmes, indicators, beneficiaries, surveys, tasks and pages.
Chapter VIII
Report
A live link for the funder, reports in the funder’s own format, portfolio figures that show their working, and a straight line to Power BI.
The donor link
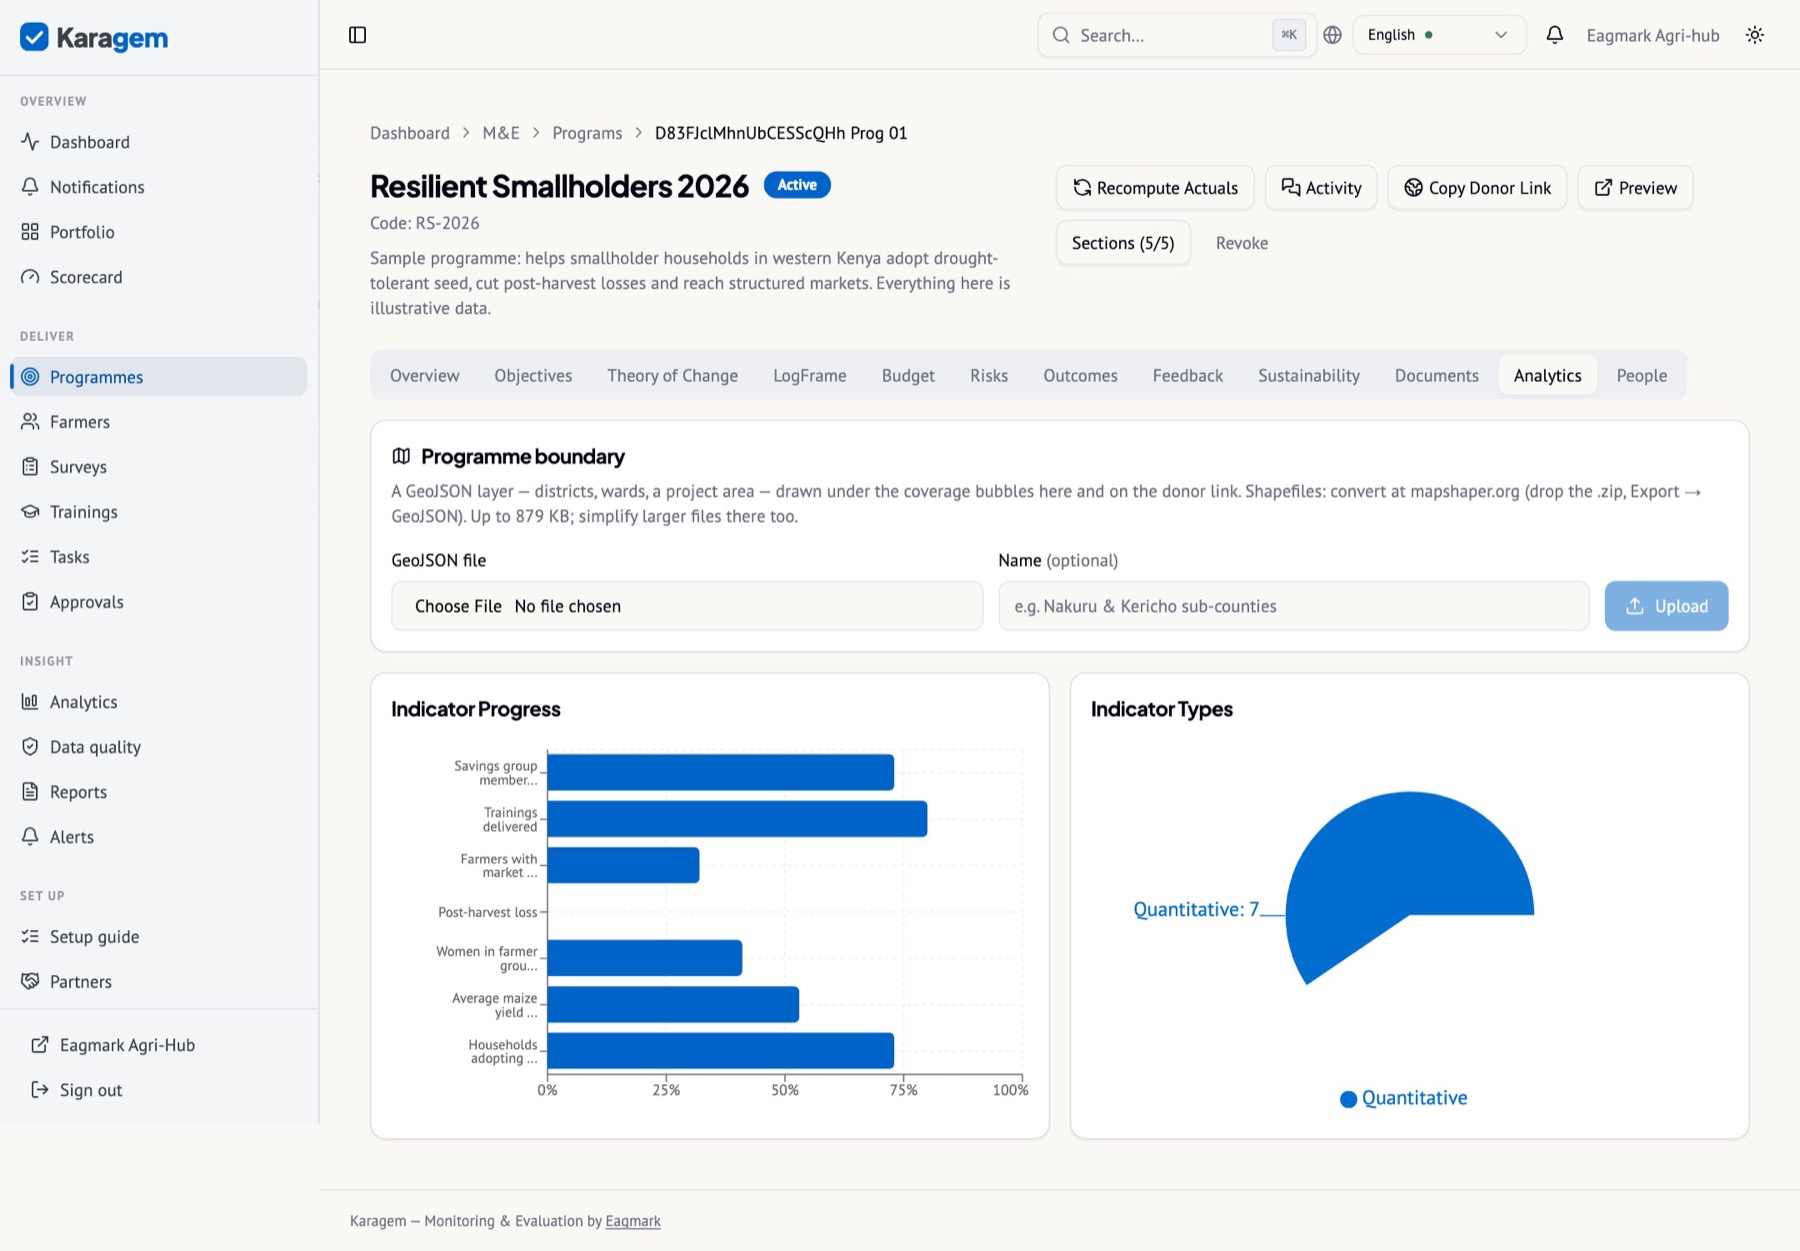
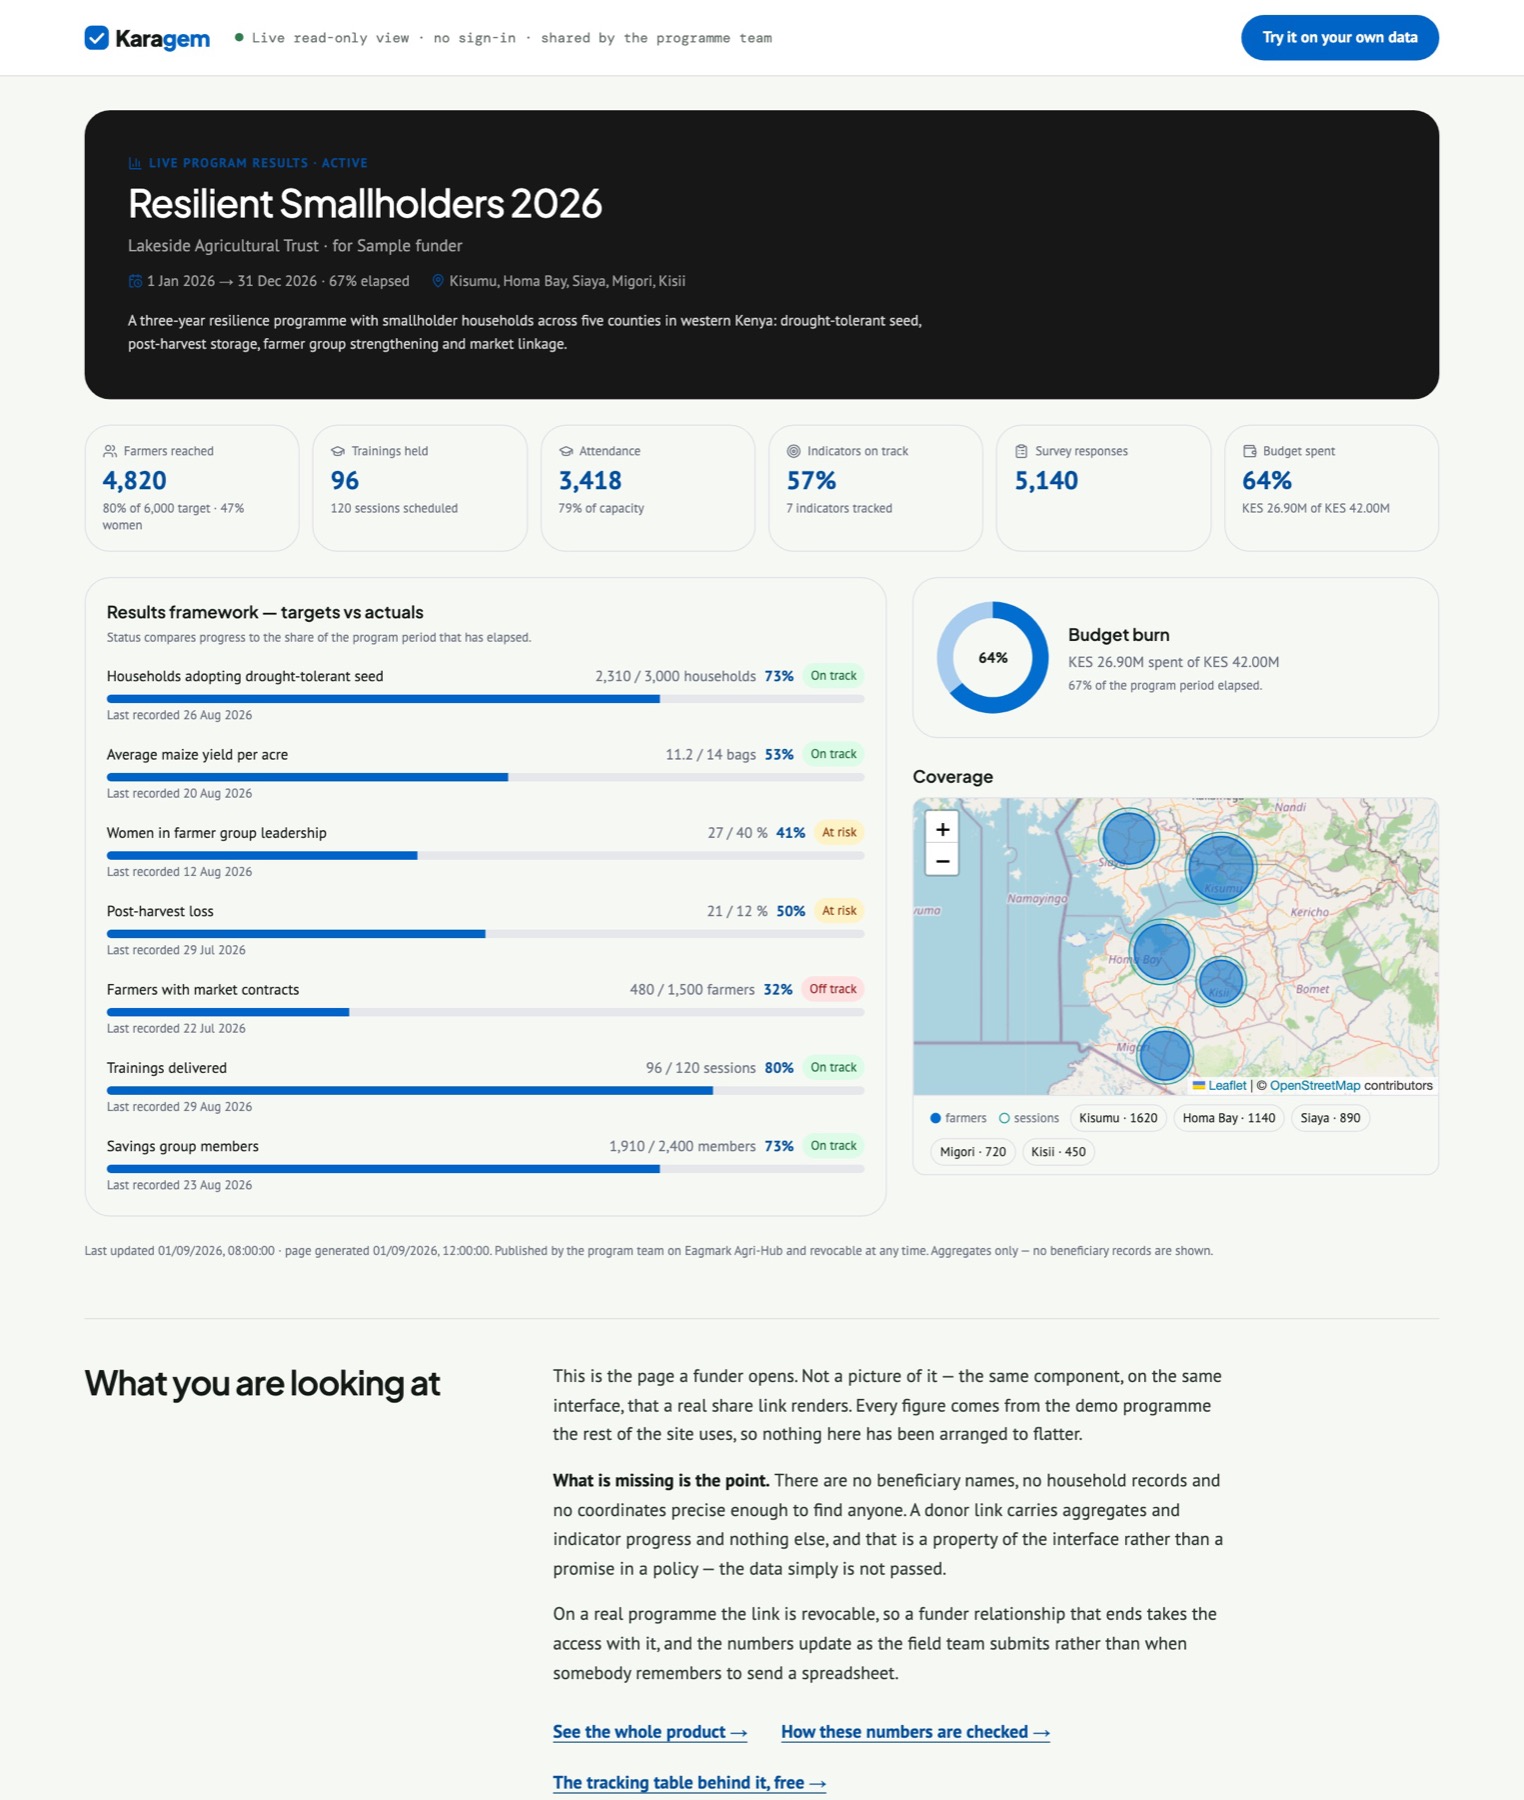
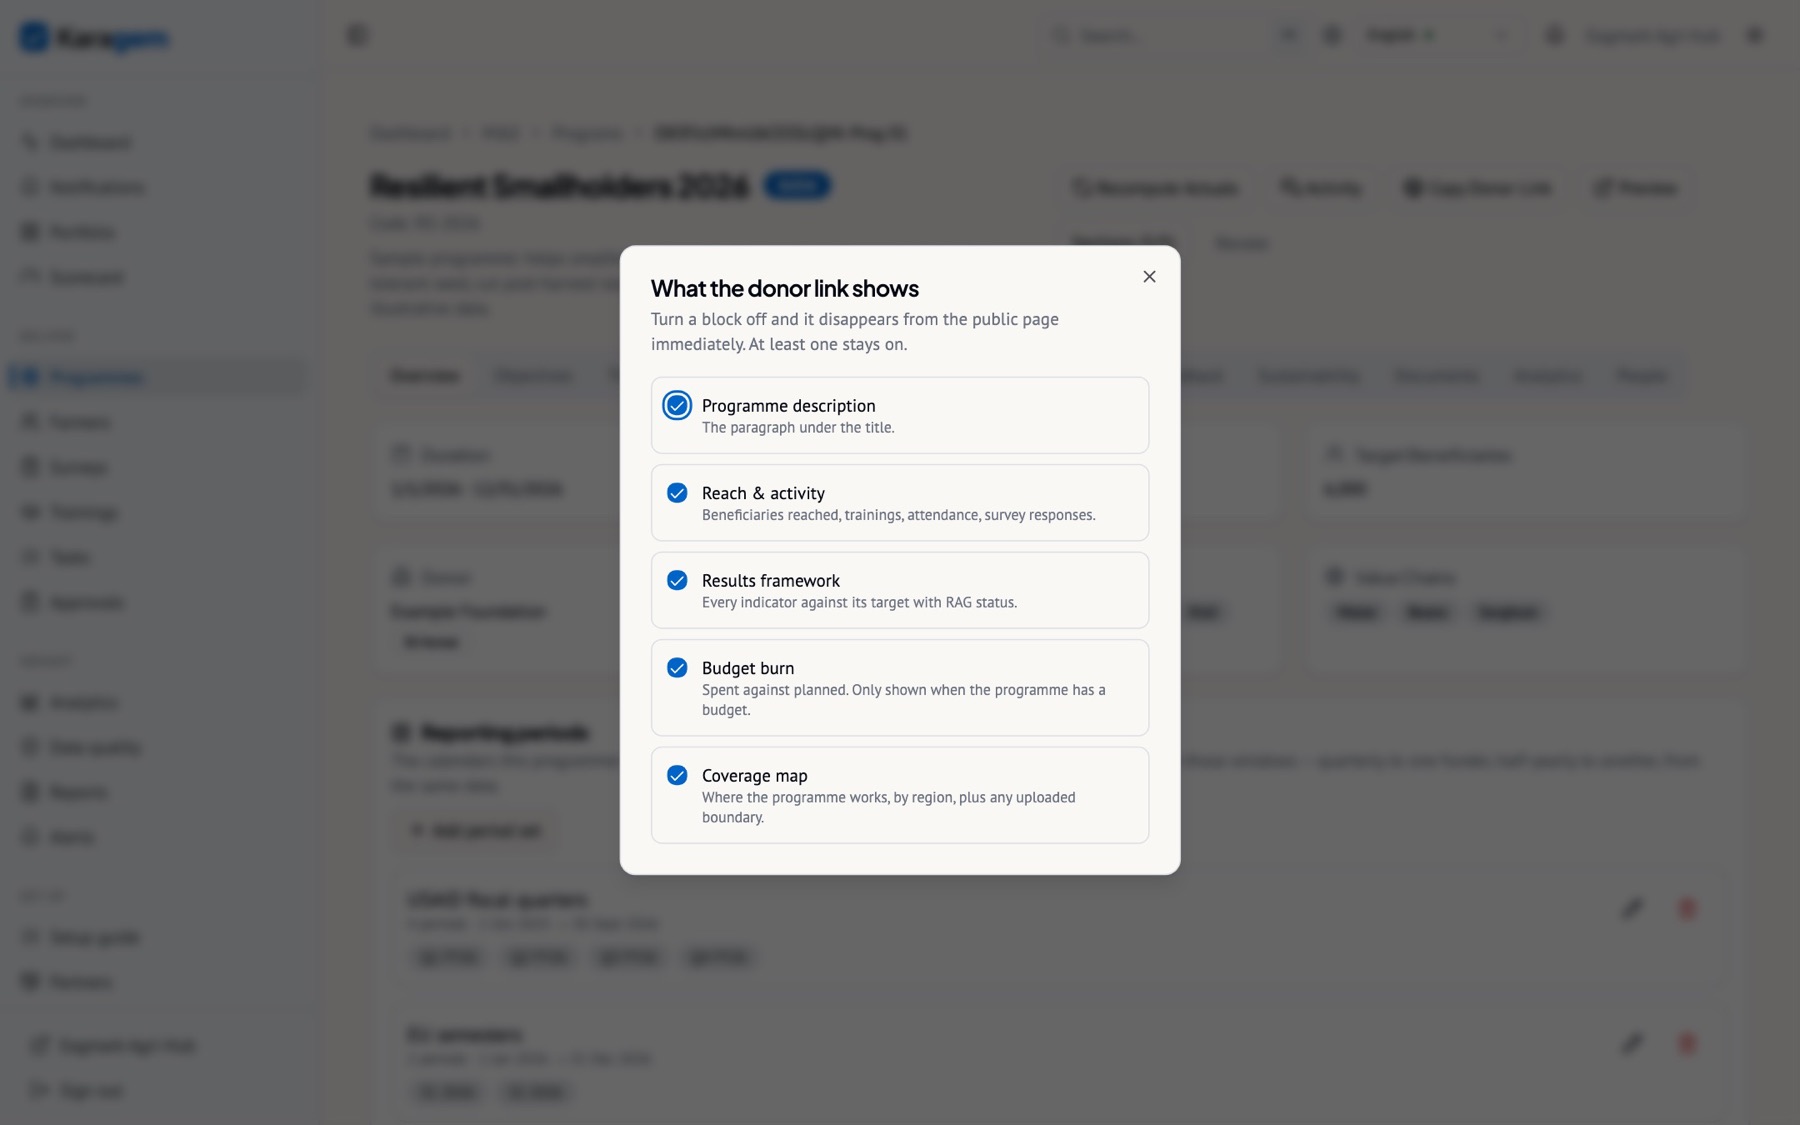
Each programme can publish a read-only results page at a revocable link. It shows aggregates only — reach, indicators against target with RAG status, budget burn, coverage on a map with the programme boundary — and never a beneficiary name, contact or precise location. Five checkboxes decide which blocks appear; a funder who wants only the results framework gets only that. Revoke the link and the page is gone; create it again and the same address returns.
Publish a donor link
- Programme → Create donor link. Copy it; Preview opens what the funder will see.
- Sections chooses which blocks are shown. Upload a boundary on the Analytics tab if you want your own districts drawn on the map.
- Revoke at any time from the same place.
Reports in the funder’s format
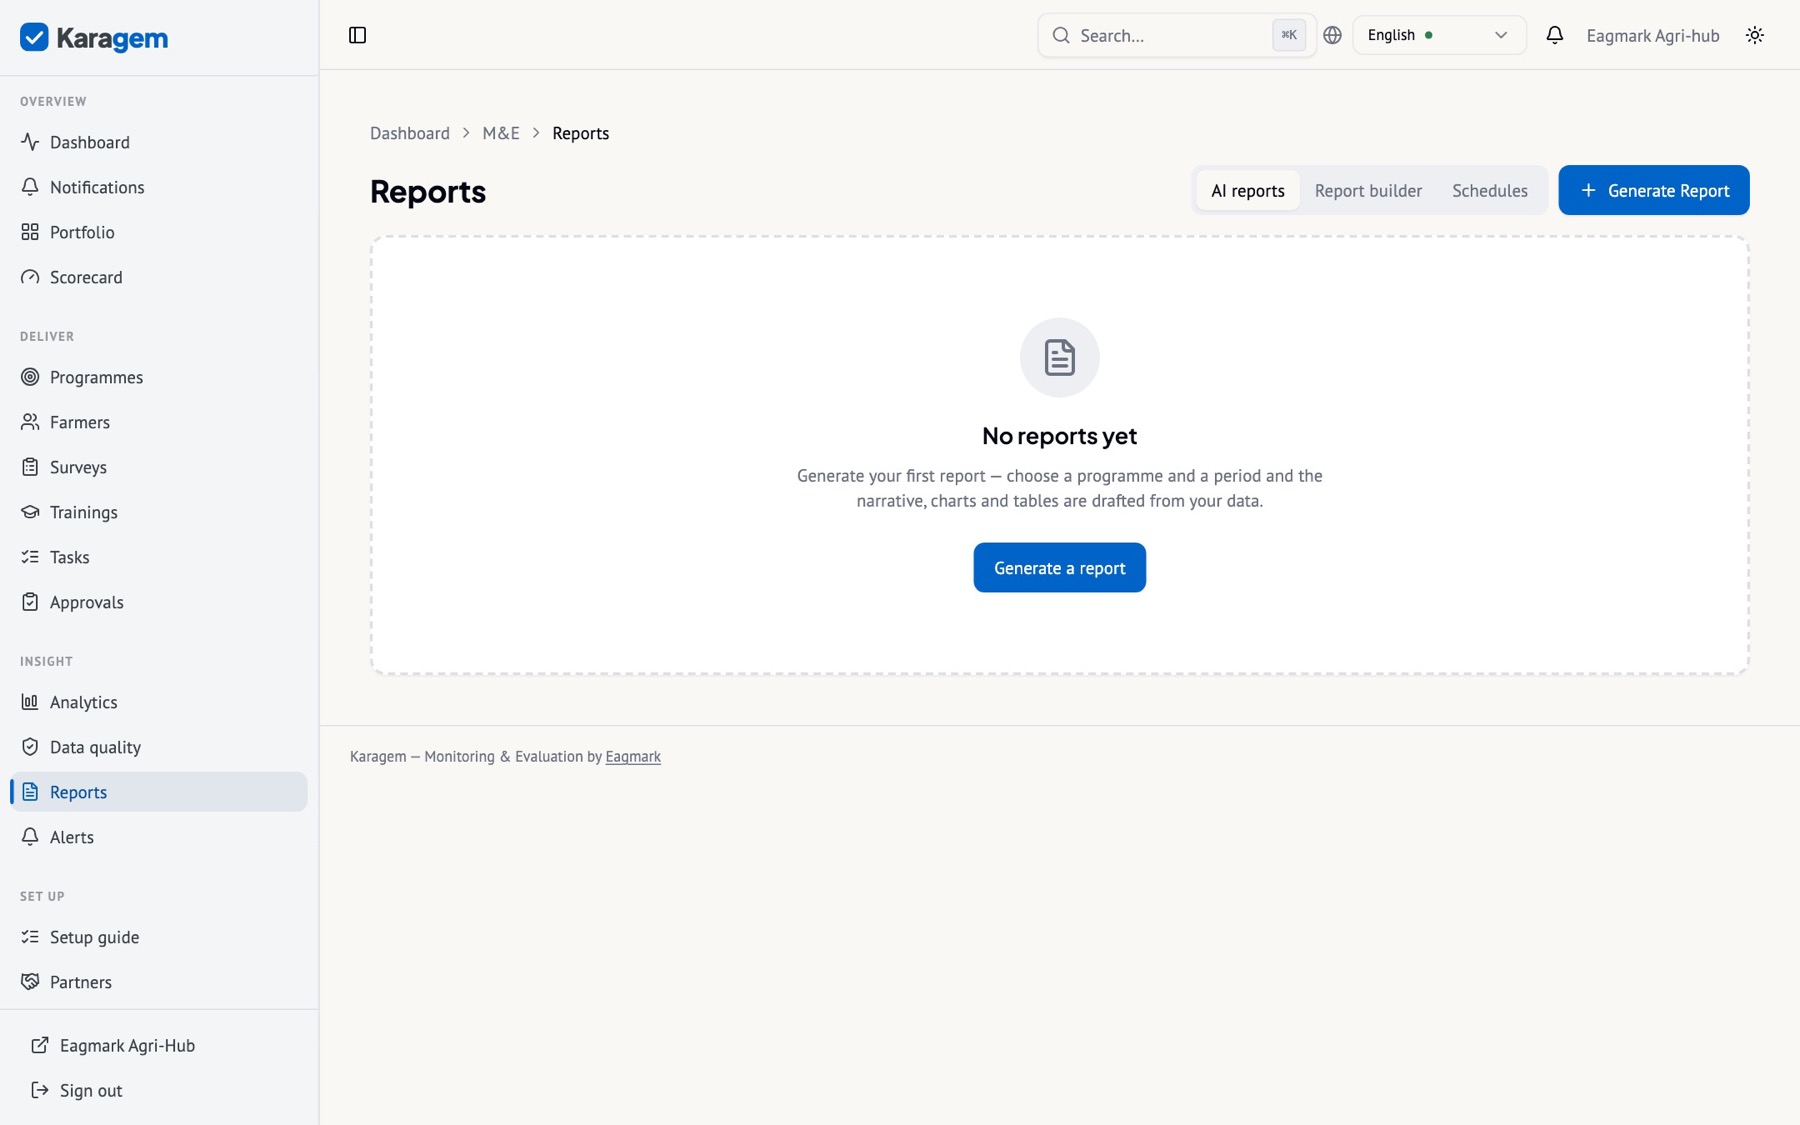
- Donor templates — USAID PPR/IPTT, EU logframe reporting, World Bank results framework and FCDO annual review tables, generated from the same indicators so the numbers agree across funders.
- Report builder — choose programmes, indicators, periods, disaggregations and sections; save the definition; run it again next quarter.
- Narrative — a draft narrative written from the recorded data and the change log, edited by you before it leaves.
- Schedules — a saved report runs monthly or quarterly and lands in the bell and by email.
Portfolio indicators
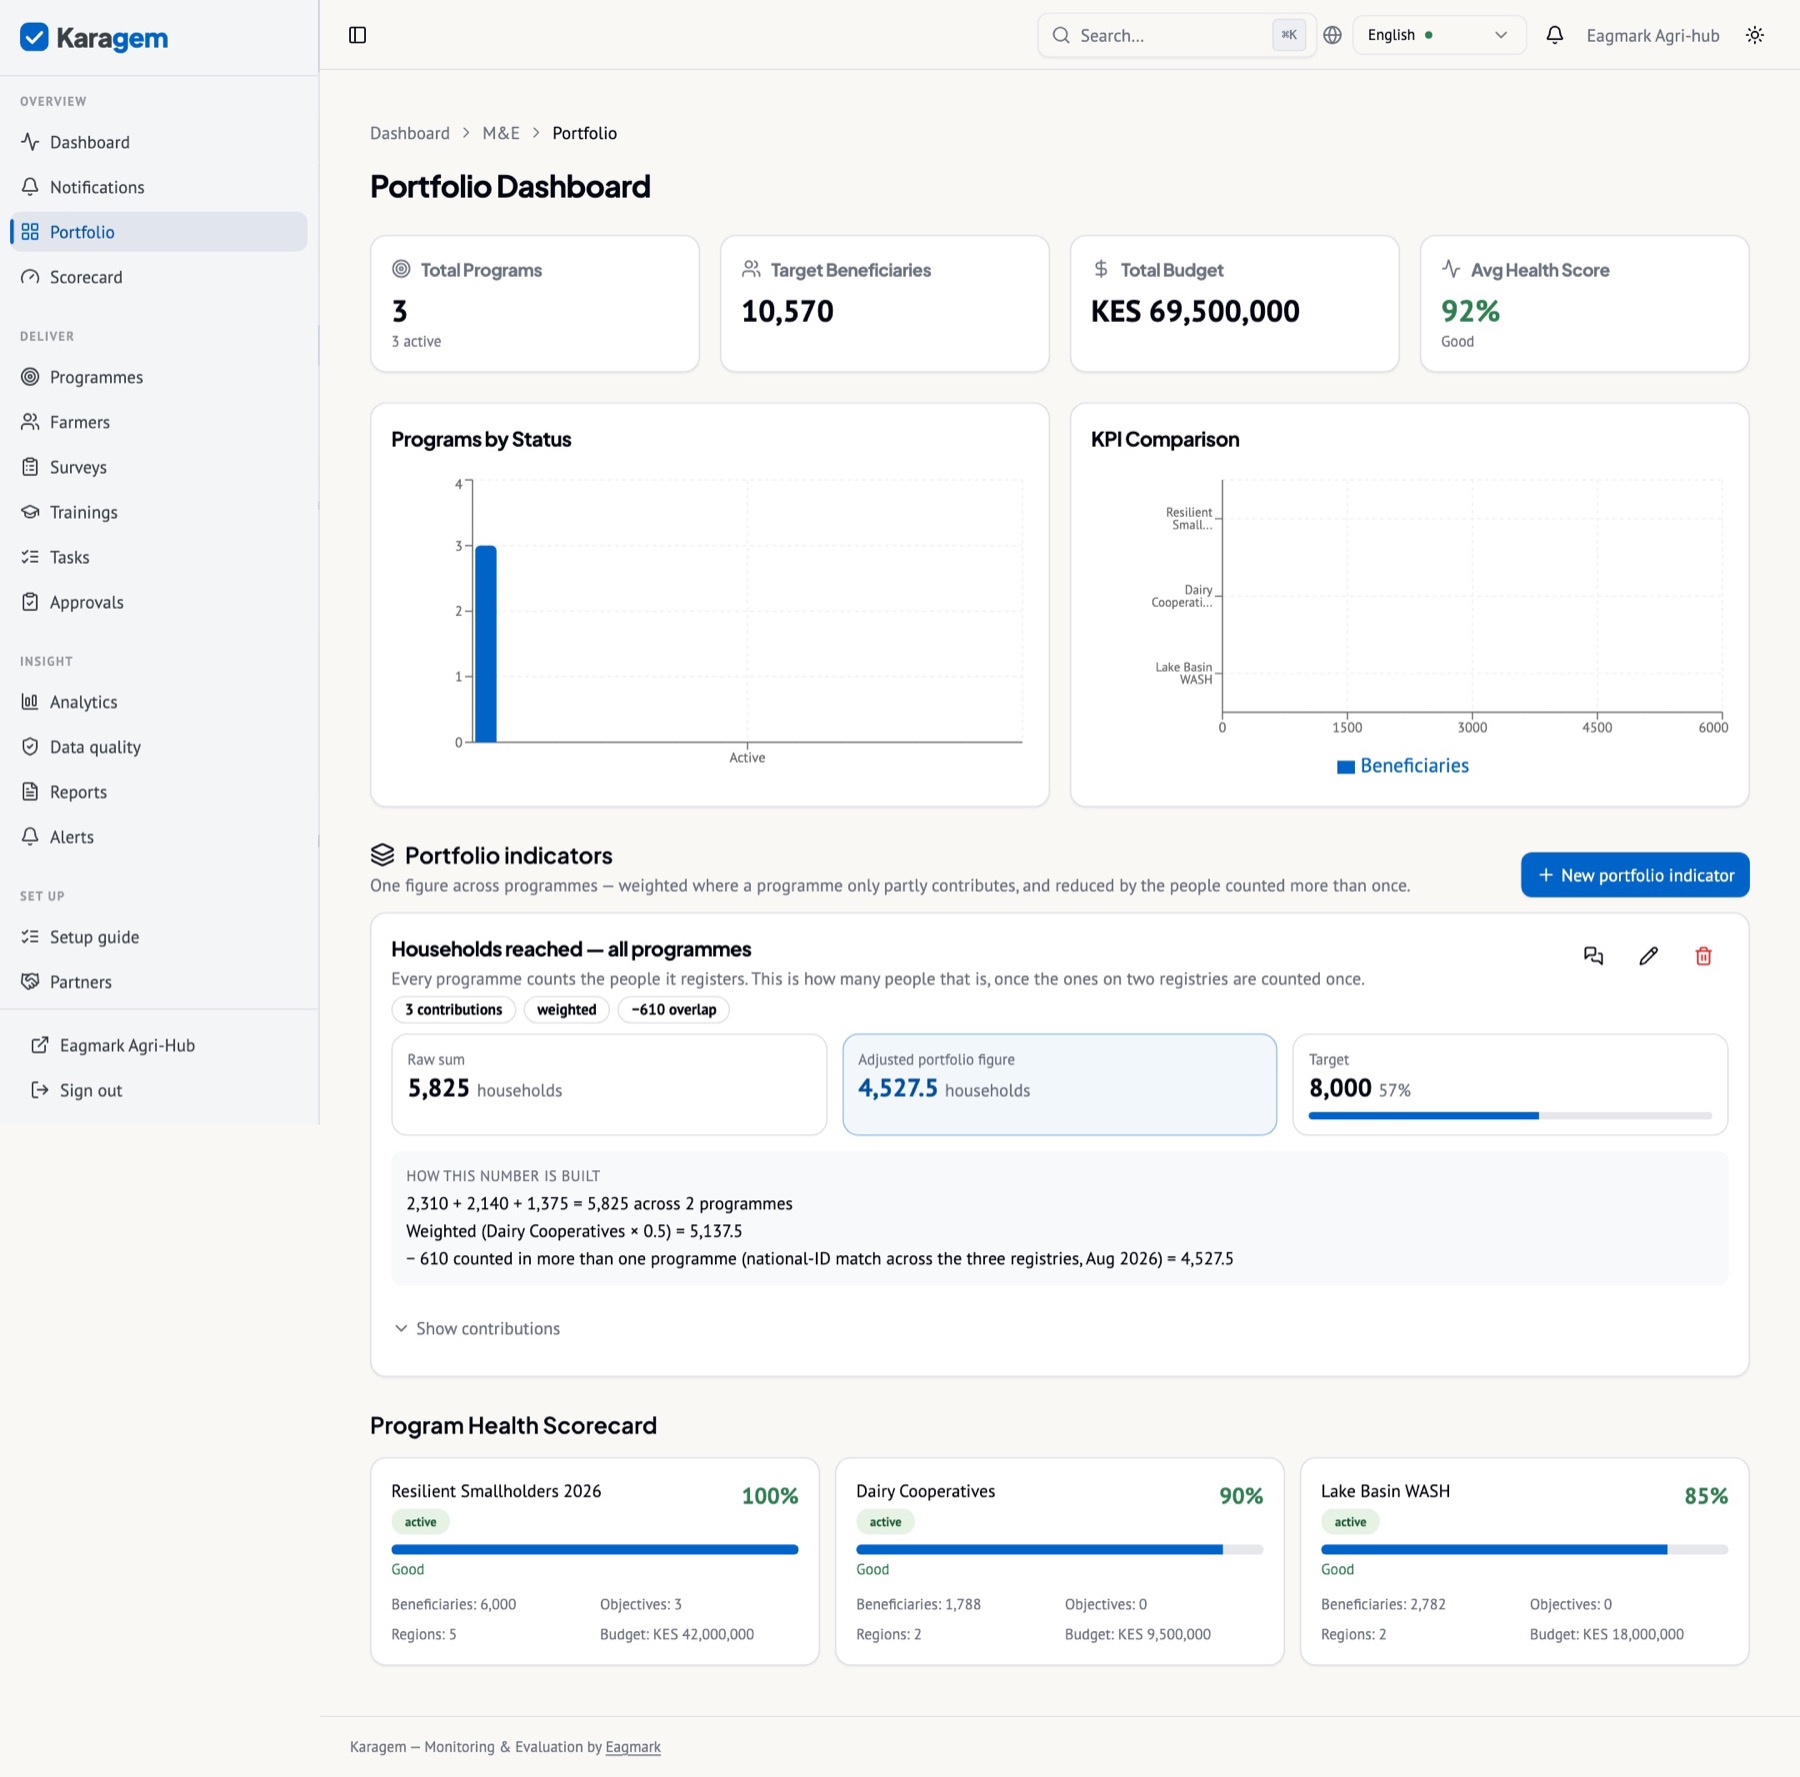
Three programmes each count the people they register. Add them up and you have counted some people twice. A portfolio indicator combines indicators across programmes with a weight per contribution (a programme that only half-belongs contributes half) and an explicit overlap adjustment (the number of people on more than one registry, and how you know), and prints the arithmetic under the number: raw sum, weighted sum, minus overlap, adjusted figure against target.
Build a portfolio figure
- Portfolio → New portfolio indicator. Name it and set the unit and target.
- Tick the contributing indicators programme by programme; set a weight below 1 for partial attribution.
- Enter the overlap and how you know it (a national-ID match across registries, a survey, a judgement). The preview updates as you type.
Exports, Power BI and Excel
Every table exports to Excel or CSV from its own screen, and the API serves the same data as JSON or CSV. Nothing is locked in.
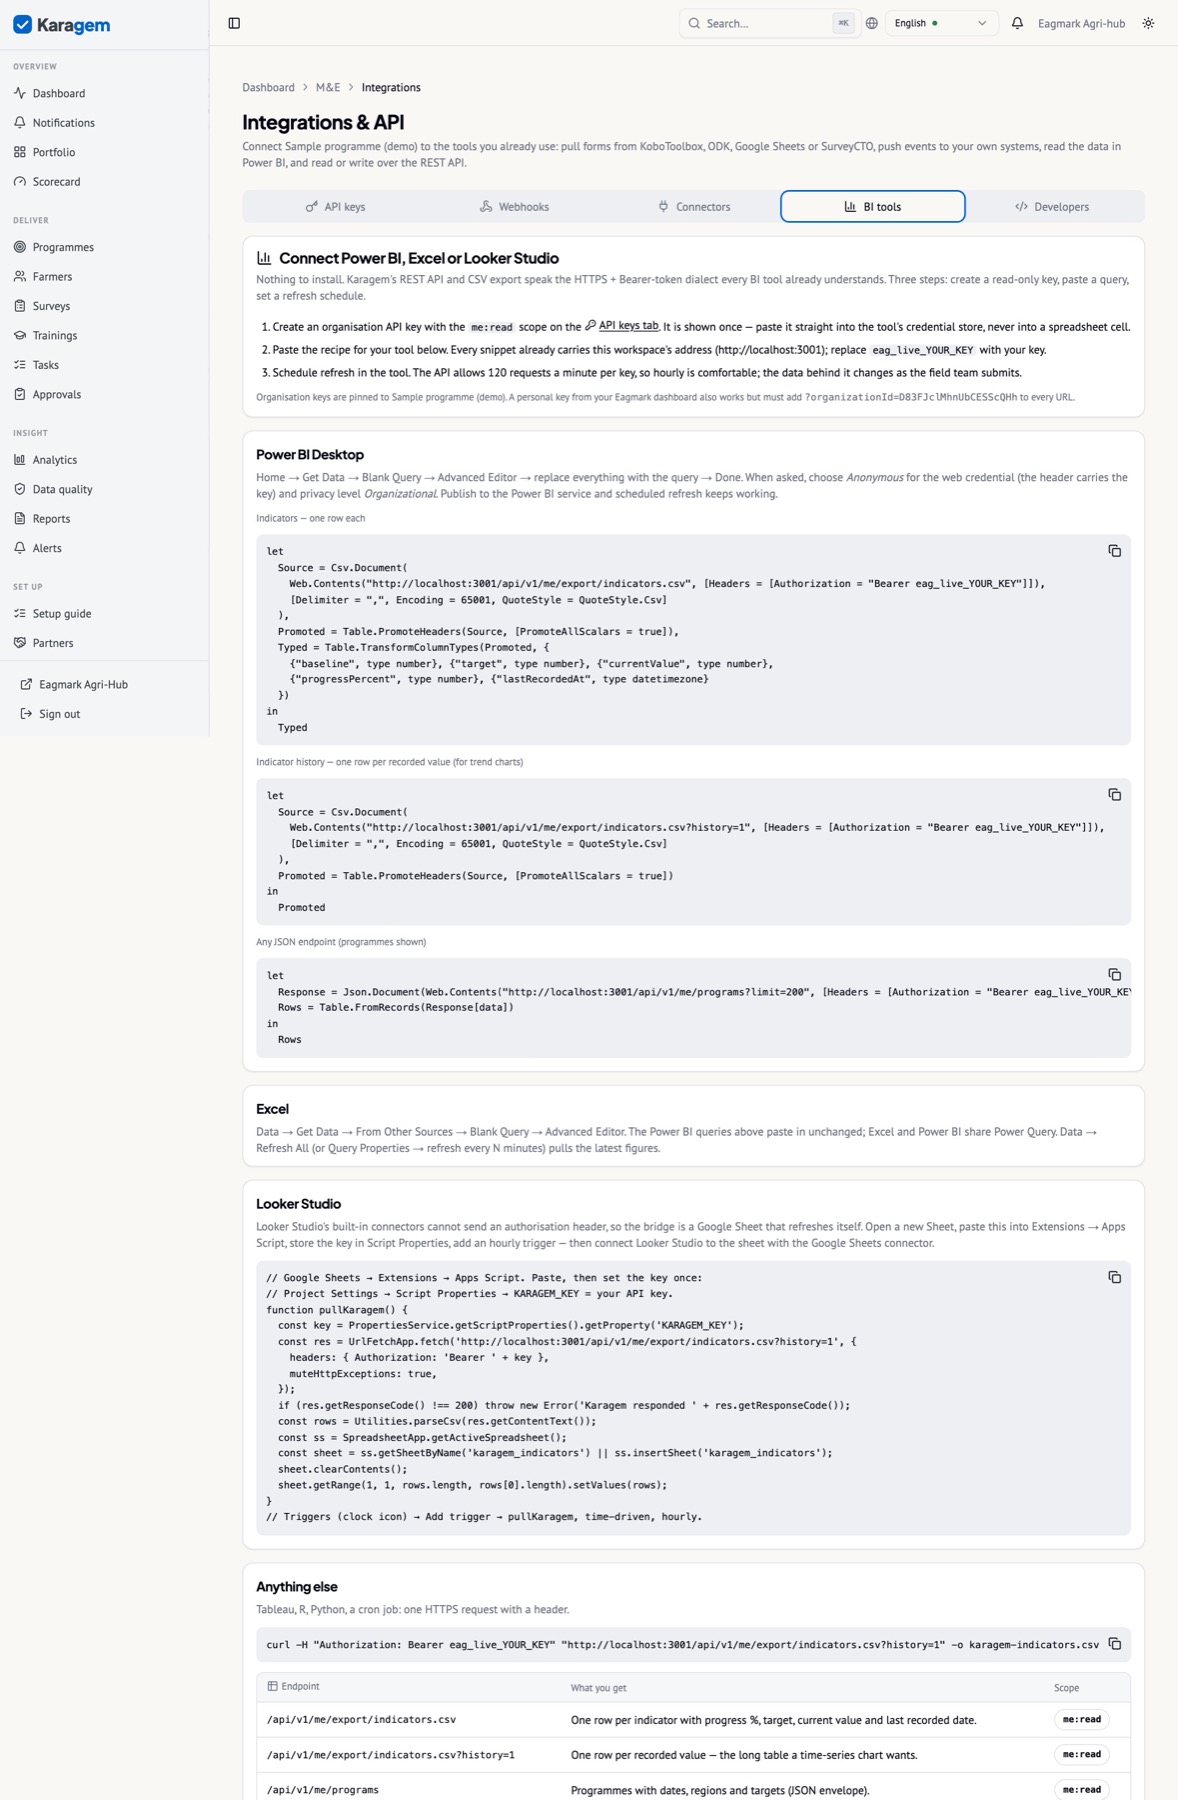
Connect Power BI
- Integrations → API keys → create a read-only key.
- Integrations → BI tools → copy the Power Query. In Power BI: Get Data → Blank Query → Advanced Editor → paste → replace the key placeholder.
- Set a scheduled refresh; the data updates as the field team submits.
Chapter IX
People and permissions
Three organisation roles, a fourth for programme-level view-only access, and overrides per programme for consortium and multi-funder work.
Roles
| Role | Manage | Edit | Collect | View | Typical holder |
|---|---|---|---|---|---|
| Programme manager | ✓ | ✓ | ✓ | ✓ | Country director, programme lead, the organisation owner |
| M&E officer | ✓ | ✓ | ✓ | M&E officer, data manager | |
| Field officer | ✓ | ✓ | Enumerator, community mobiliser, trainer | ||
| View only (programme override) | ✓ | A partner or funder staff member given workspace access to one programme |
Manage covers people, settings, deleting and publishing. Edit covers the framework: indicators, surveys, approvals, reports. Collect covers registering beneficiaries, submitting responses and taking attendance. Every member can view.
Roles per programme
A member has one organisation role. On any programme a manager can override it — demote an officer to view-only on a programme they merely observe, or promote a field officer to officer on the one they run. The override applies inside that programme only and is enforced on the server, not just hidden in the interface: an officer made a viewer on Programme B is refused when they try to edit it even through the API.
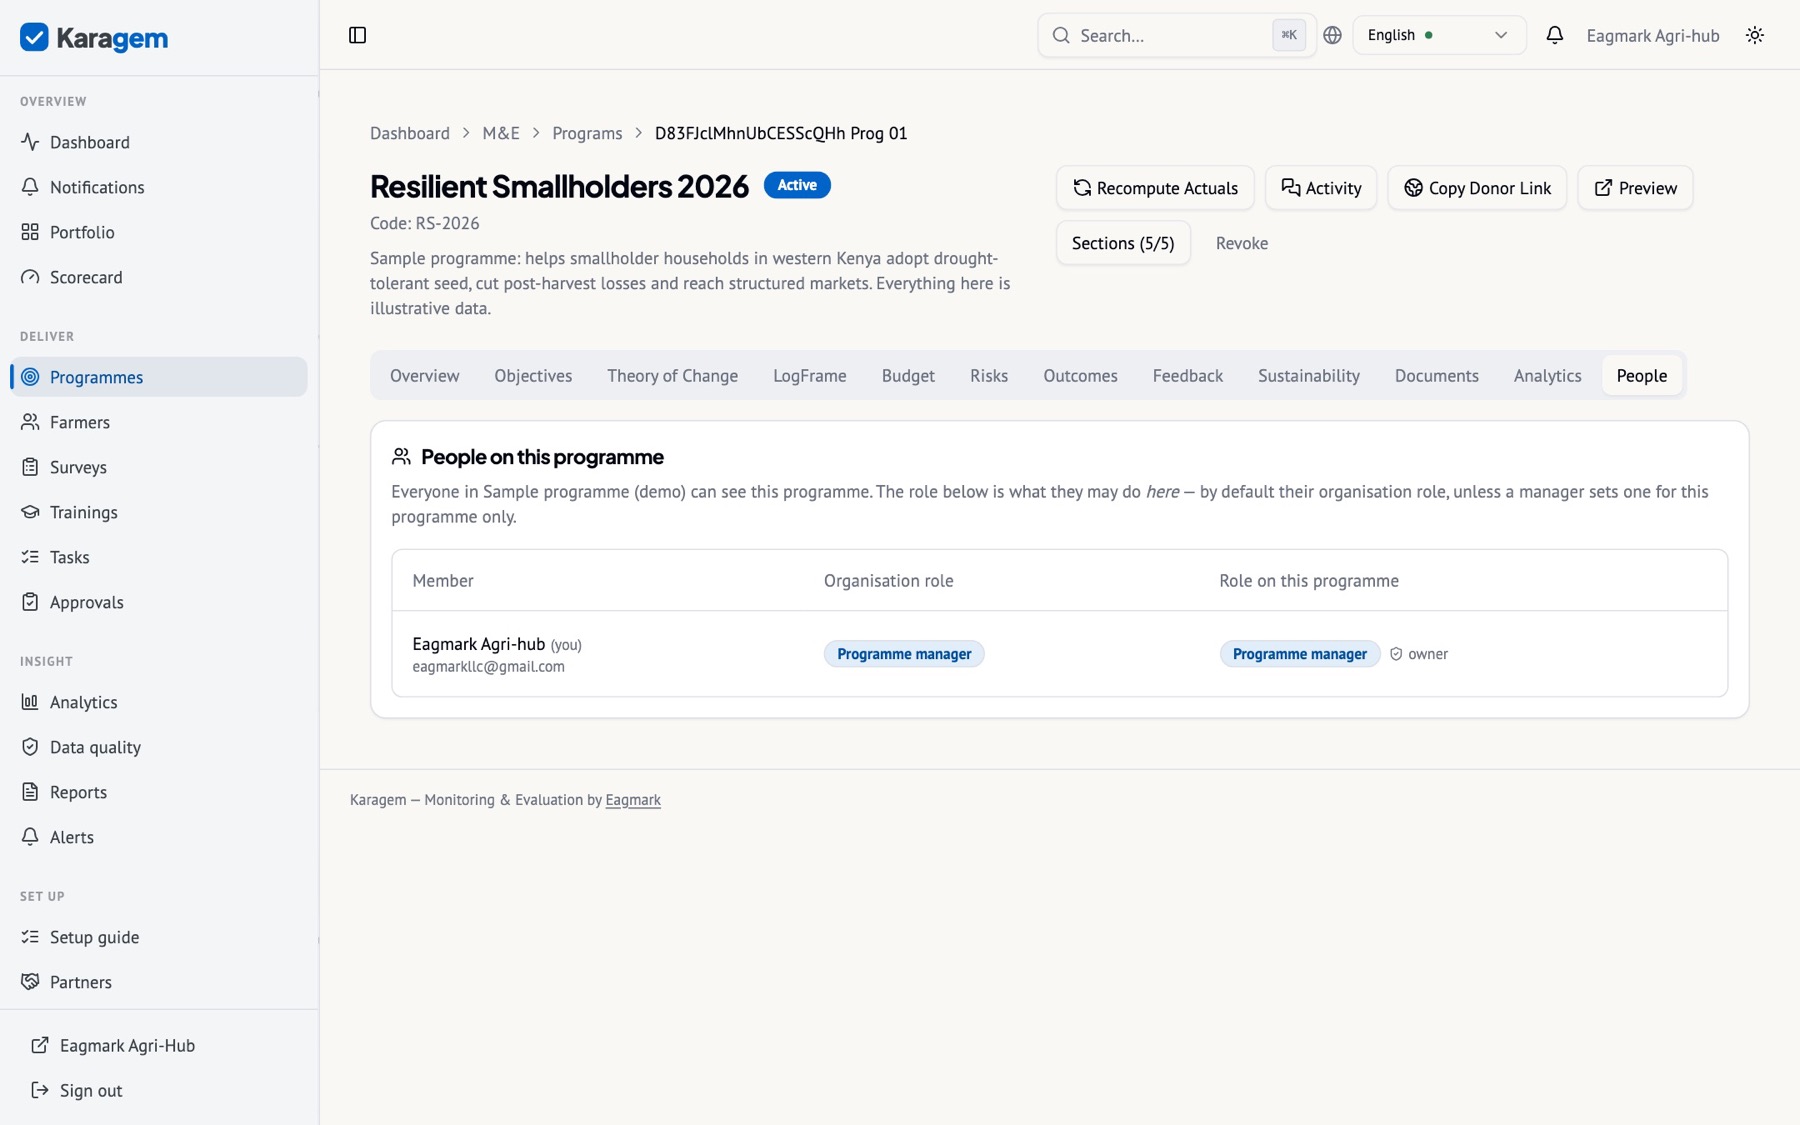
Give someone a different role on one programme
- Programme → People.
- Choose the role in the selector next to their name, or Inherits to remove the override.
- The change is logged with who made it.
Chapter X
Security, hosting and data protection
Where the data lives, who can read it, what leaves the device, and what never appears in public.
Hosting and access
- Karagem runs on Google Cloud through Firebase (App Hosting, Firestore, Cloud Storage, Firebase Authentication). Google Cloud infrastructure holds ISO/IEC 27001, 27017, 27018 and SOC 1/2/3 attestations.
- Every record carries its organisation, and Firestore security rules plus server-side guards check organisation membership — and the programme-level role — on every read and write. Secrets (integration credentials, webhook signing keys, API keys) are never readable from the browser.
- Sign-in is by email and password or passkey; sessions are short-lived cookies scoped to eagmark.net. Organisation API keys carry explicit scopes and are shown once.
- Backups and replication are Firestore’s: multi-region, continuous. An organisation can export all its data at any time from Settings → Data management, and delete itself.
Data on the device
Offline submissions are held in the browser’s IndexedDB on the enumerator’s device until synced, then removed. Signing out clears the queue only after it has synced; an unsynced queue is preserved and surfaced so nothing is lost silently. The install card names the device it is on and explains what is stored.
Personal data
- Donor links carry aggregates only. No beneficiary name, contact or precise coordinate is passed to the public page — this is a property of the interface, not a policy promise.
- API keys need the personal-data scope to include identifiers in beneficiary records.
- Sample data contains no real person: names are synthetic and phone numbers use the reserved +999 country code, and the messaging screens refuse to send to them.
- Each organisation is the controller of the data it enters and remains its owner; Eagmark processes it to run the service. The data-processing summary in Settings can be attached to a funder’s due-diligence file.
Chapter XI
Pricing, training and support
Per organisation, never per seat; training that counts toward a certificate; support from the people who build the product.
Plans
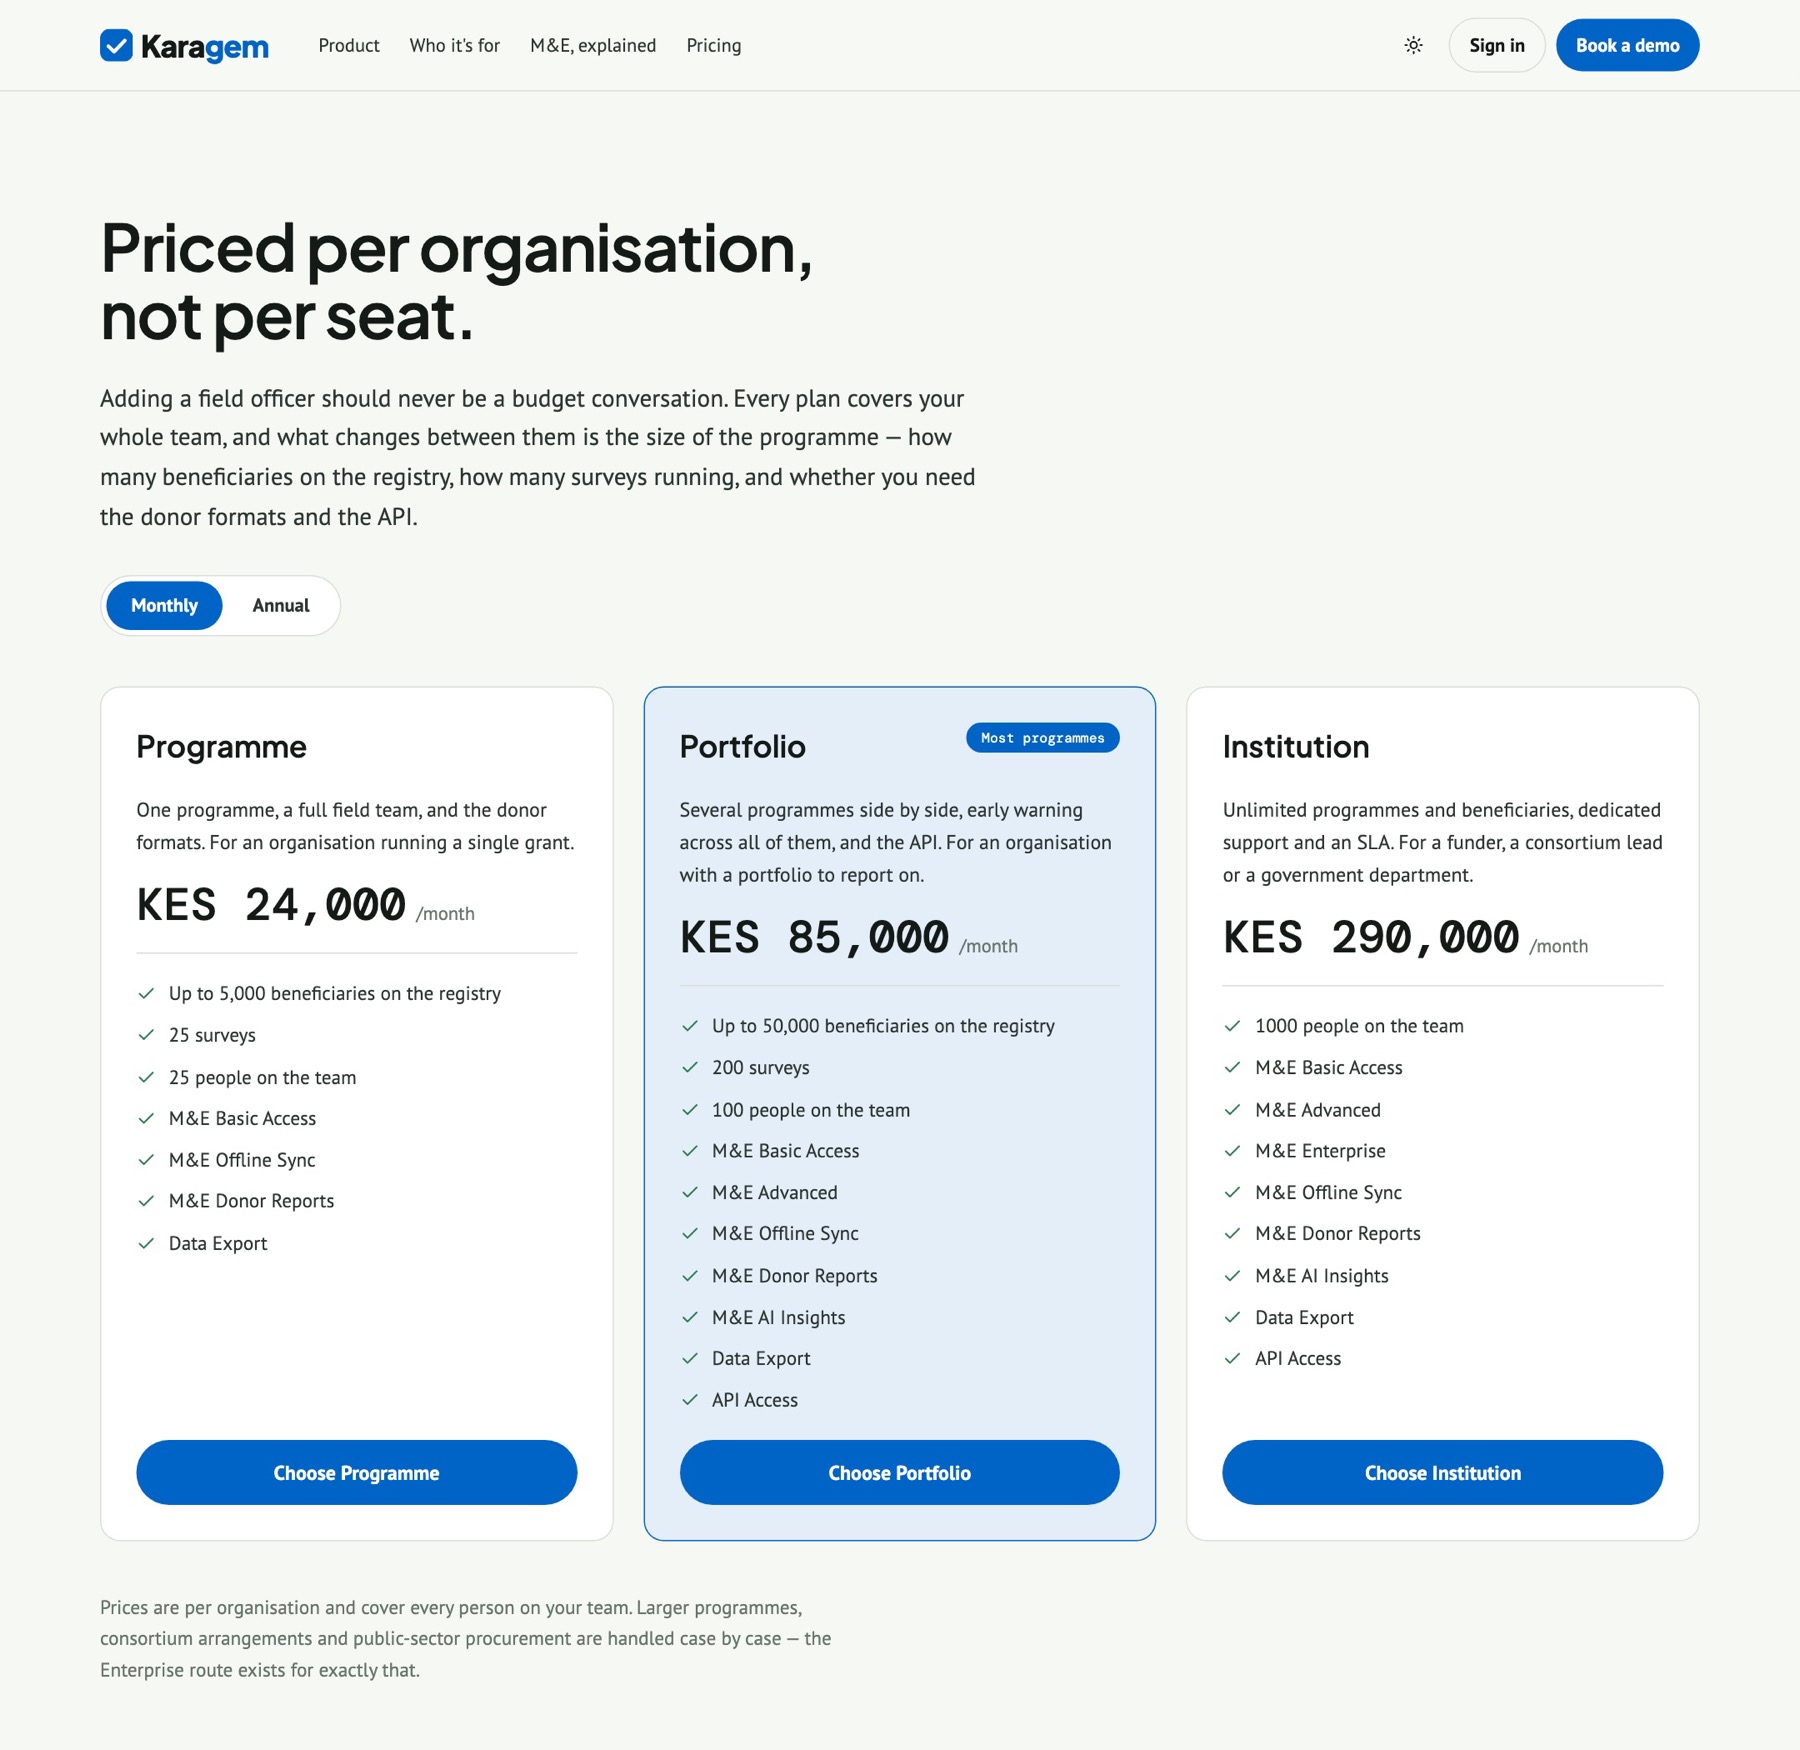
Every plan covers your whole team. Payment is by card or mobile money through Paystack, monthly or annually. Larger programmes, consortium arrangements and public-sector procurement are handled case by case.
Training
Karagem is built by Eagmark, which also runs courses. Three are directly relevant and each ends with a verifiable certificate: Monitoring & Evaluation in Agricultural Projects (6 weeks), Project Management in Agriculture (12 weeks) and Data Management in Agriculture (4 weeks). They are optional; the product is designed to be learnt from the setup guide and this document.
Support
Support is through eagmark.net/contact. Product updates deploy continuously; every change is listed in the product’s feature log, and nothing in this guide describes a feature that is not live at the time of writing. The current version of this document is always at me.eagmark.net/guide, with the PDF at me.eagmark.net/guide/download.
Chapter A
Appendix
A quick reference, a glossary, and the screen index.
Quick reference
| I want to… | Go to |
|---|---|
| See what is wrong today | Dashboard |
| Record an indicator value | Programme → Objectives → Record value on the card |
| Compute an indicator from a survey | Indicator card ⋯ → Feed from a survey; accept proposals on the card or in Approvals |
| Put a finished programme away | Programme → Status → Archive (kept, hidden, reversible) |
| Work in another organisation | Sidebar header → organisation switcher |
| Import values from a spreadsheet | Programme → Objectives → Import |
| Approve a submission | Approvals → Pending |
| See who changed a number | Indicator ⋯ → Changes & discussion |
| Ask a colleague about a record | Same drawer → Discussion → type @ |
| Collect without signal | Install the app; Collect |
| Share results with a funder | Programme → Create donor link |
| Report in USAID/EU/World Bank/FCDO format | Reports → Donor templates |
| Count people across programmes once | Portfolio → New portfolio indicator |
| Report on the funder’s calendar | Programme → Overview → Reporting periods |
| Give someone view-only on one programme | Programme → People |
| Bring Kobo / ODK / Sheets / SurveyCTO data into a programme | Integrations → Connectors → Import as survey → pick the programme → Import submissions |
| Identify disability by functioning (Washington Group) | Settings → Profile fields → Presets; or Survey builder → Insert block |
| Open every interview with recorded consent | Survey builder → Insert block → Informed consent |
| Set up for my country and sector | Settings → General |
| Feed Power BI | Integrations → BI tools |
| Search anything | ⌘K / Ctrl+K |
Glossary
| Term | Meaning in Karagem |
|---|---|
| Indicator | A measurable quantity with a baseline, target, unit and frequency, belonging to a programme and one or more objectives. |
| Baseline / target | The value at the start and the value aimed for by programme end. Direction of good says whether higher or lower is better. |
| Disaggregation | A dimension (Gender, Age group, Region…) by which a recorded value is broken down; each dimension’s parts add up to at most the total. |
| RAG | Red / amber / green status from progress against the share of the programme period elapsed. |
| Reporting period set | A named calendar (e.g. USAID fiscal quarters) with labelled date windows; indicators pick one for targets and tracking. |
| Approval | A pending decision on a survey response, indicator value, expenditure or registration before it counts. |
| Change log | The append-only record of every field change on a record: who, when, before, after, source. |
| Portfolio indicator | One figure built from indicators across programmes with weights and an overlap adjustment. |
| Donor link | A revocable public page showing a programme’s aggregates only. |
| Logframe | The logical framework: goal, outcomes, outputs, activities, indicators, means of verification, assumptions. |
| DQA | Data quality assessment: validity, reliability, timeliness, precision, integrity. |
| Outbox | Submissions held on a device until they sync. |
| Connector | A saved link to a KoboToolbox, ODK Central, SurveyCTO or Google Sheets source. Its forms become surveys in your programmes and their submissions are pulled as responses. |
| Survey feed | A rule that computes an indicator from a survey question per reporting period. It proposes values; a person accepts or declines them unless auto-accept is on. |
| Washington Group Short Set | Six questions on functioning (seeing, hearing, walking, remembering, self-care, communicating). A functional difficulty is at least one answer of A lot of difficulty or Cannot do at all; Karagem computes it, nobody types it. |
| Consent gate | Skip logic that hides every question in a survey until the informed-consent decision is Yes. |
| Level-1 unit | The organisation’s first administrative division — county, district, state, region, province — named in Settings; every form and report uses that word. |
Screen index
| Screen | Address | Chapter |
|---|---|---|
| Dashboard | /me | VII |
| Notifications | /me/notifications | VII |
| Portfolio | /me/portfolio | VIII |
| Scorecard | /me/scorecard | VII |
| Programmes | /me/programs | IV |
| Beneficiaries | /me/farmers | V |
| Surveys | /me/surveys | V |
| Trainings | /me/trainings | V |
| Tasks | /me/tasks | VII |
| Approvals | /me/approvals | VI |
| Analytics | /me/analytics | VII |
| Data quality | /me/quality | VI |
| Verification | /me/evidence | VI |
| Reports | /me/reports | VIII |
| Alerts | /me/alerts | VII |
| Collect (phone) | /me/collect | V |
| Setup guide | /me/setup | III |
| Partners | /me/partners | IV |
| Indicator library | /me/indicators/library | IV |
| Integrations | /me/integrations | V, VIII |
| Settings | /me/settings | III, IX |
| Donor link (public) | /verify/program/<link> | VIII |
| Receipt check (public) | /verify/visit | VI |
| This guide | /guide | — |